Antidepressant effects in hybrid striped bass: moving from external exposures to internal doses
Antidepressant Effects in Hybrid Striped Bass:
Moving from External Exposures to Internal DosesLauren Sweet
Clemson University,
[email protected]
Follow this and additional works at:
Recommended CitationSweet, Lauren, "Antidepressant Effects in Hybrid Striped Bass: Moving from External Exposures to Internal Doses" (2015).
AllDissertations. Paper 1530.
This Dissertation is brought to you for free and open access by the Dissertations at TigerPrints. It has been accepted for inclusion in All Dissertations byan authorized administrator of TigerPrints. For more information, please contact
ANTIDEPRESSANT EFFECTS IN HYBRID STRIPED BASS:
MOVING FROM EXTERNAL EXPOSURES TO INTERNAL DOSES
the Graduate School of
Clemson University
In Partial Fulfillment
of the Requirements for the Degree
Doctor of Philosophy
Environmental Toxicology
Dr. Stephen J. Klaine, Committee Chair
Dr. Joseph H. Bisesi, Jr.
Dr. Thomas E. Schwedler
Over 47 percent of Americans take at least one prescription drug per month and of
these pharmaceuticals, antidepressants are the third most prescribed drug. Their
widespread and prolonged use coupled with incomplete removal during wastewater
treatment processes has made them one of the most commonly detected pharmaceuticals
in the aquatic environment. Antidepressants are intended to modify human behavior by
altering brain chemistry and the neurotransmitter receptor targets of these chemicals are
highly conserved in many vertebrate species; thus, aquatic organisms may be at risk.
Previous research in our lab has shown that exposure of hybrid striped bass (HSB)
(
Morone saxatilis x. M. chrysops) to serotonin targeting antidepressants causes decreased
in brain serotonin concentrations that correlate with significant changes in time to capture
The goal of this dissertation was to gain a better understanding of how antidepressants
alter brain chemistry and predatory behavior in the hybrid striped bass, and to utilize the
information to develop a preliminary model to predict the effects of antidepressants on
fish brain chemistry and behavior.
Hybrid striped bass were exposed to bupropion, a norepinephrine and dopamine
reuptake inhibitor antidepressant, to understand if alteration of the dopaminergic
neurotransmitter concentrations in the HSB would alter a predator's ability to capture
prey. HSB were exposed to bupropion in a static system for 6 days, followed by a 6 day
recovery period. Bupropion altered the concentration of dopamine and many of the
dopaminergic neurotransmitter metabolite concentrations in the HSB brains on day 3 of
the exposure, but it did not alter the HSB time to capture prey. The lack of effect on time
to capture prey suggests that alteration of dopaminergic neurotransmitter concentrations
in the HSB brain does not alter a predator's ability to capture prey and led to focusing of
future work on serotonin targeting antidepressants, such as the selective serotonin
reuptake inhibitor (SSRI) class.
The target of SSRI antidepressants is the serotonin reuptake transporter (SERT).
The SERT transporter has been identified in a few fish species, but not the hybrid striped
bass. I utilized recently sequenced striped bass and white bass transcriptomes as well as
conserved sequences from aligned serotonin reuptake transporters of other vertebrate
species to design primers for cloning. I was able to sequence roughly 80% of the SERT,
compared to the striped bass sequence, and found that it had 72% identity to the human
SERT. The functional domains identified in the human SERT were highly conserved
with the amino acid residues in the hybrid striped bass. The binding affinity of SSRI
antidepressants were quantified for the SERT in a HSB brain homogenate using
competitive radioligand binding assays with [3H] citalopram, a tritium labeled SSRI. In
general, the HSB antidepressant binding affinities were less potent than affinities
observed for the human SERT. These results confirmed that the SERT is conserved and
present in the HSB, and that antidepressants are binding to the SERT in the HSB brain.
The bioavailability of two serotonin targeting antidepressants, fluoxetine and
venlafaxine, was quantified by exposing HSB to each drug and quantifying
antidepressant concentrations in HSB plasma and brains. Fluoxetine and venlafaxine
brain concentrations strongly correlated with decreases in brain serotonin concentrations
and time to capture prey, providing internal antidepressant concentrations that correspond
to adverse effects on HSB brain serotonin and predatory behavior.
Antidepressants are entering the aquatic environment in complex mixtures. In
order to gain a better understanding of the effects of SSRI antidepressant mixtures on fish
brain chemistry and behavior, HSB were exposed to a mixture of sertraline, citalopram,
and fluoxetine for 6 days, followed by a 6 day recovery period. The antidepressants were
detected in the brains of the HSB throughout the recovery period, and significant changes
in all treatments were observed on day 12 of the experiment, which correlated with
significant increases in time to capture prey. Further, greater than additive changes in
brain serotonin were observed in the experiment.
Overall, the results of this dissertation indicate that SSRI antidepressants are
binding to the SERT in the HSB brain and causing adverse effects on brain serotonin and
time to capture prey. I have quantified the partitioning of antidepressants from aqueous
exposures, to plasma concentrations, to ultimately reaching the brain and exerting effects
on brain serotonin. These drugs can remain in the brain of the HSB even after being in a
clean system for 6 days, and can continue to exert greater than additive effects on brain
serotonin and alter predatory behavior. The work has furthered our understanding on how
antidepressants in the environment alter hybrid striped bass brain serotonin and predatory
To Dad, Mom, Eric, and Debi Kuiper
I would like to thank to my Ph.D. advisor, Dr. Steve Klaine, for providing this
incredible opportunity to get a degree and perform research in your lab. I'm so thankful
for your mentoring, patience, and support. It has been such a great experience to work
with you. I'd like to thank my committee: Dr. Lisa Bain, Dr. Joe Bisesi, Dr. Cindy Lee
and Dr. Tom Schwedler. You've all greatly contributed to my success at Clemson and
I'm truly thankful for your guidance and patience. A special thanks to Dr. Joe Bisesi for
acting as a mentor, and teaching me most of the skills I needed to complete this
dissertation. You're also a great friend and I know I couldn't have done any of this
without your help. I'm forever grateful. Thank you, Dr. Bain, for your guidance and
opening up your lab to me to use many instruments. Thank you, Dr. Schwedler, for
offering your expertise on sick fish at Cherry Farm and teaching me proper techniques to
identify pathogens. Thank you, Dr. Lee, for teaching me so much about environmental
chemistry, how to improve presentations, and providing insight on being a woman in
This work would not have been possible without Ron Gossett, the facility
manager at Cherry Farm. He always lended a hand in every capacity possible to make
sure the facility was running appropriately. There are not enough ‘thank you's or baked
goods to repay you for all your hard work. Another special thank you to John Smink, a
good friend, IACUC advisor, and fish timer. Your help and guidance around the Cherry
farm and Entox was always above and beyond, and truly appreciated. Norm Ellis also
was a huge help in keeping things running at Entox and helping in anyway needed.
Thanks to all past and present Klaine lab members. Kristen Beckhorn was always
willing to lend a helping hand in any way possible, whether with science or trying to find
a job. Special thanks to two undergraduate students that helped tirelessly one summer
with many exposures, Anna Lee McLeod and Sara Webb, I couldn't have done it without
you guys. Anna Lee continued to help maintain cultures at Cherry Farm, helped with
experiments and provided companionship during long hours of sample analysis. Kim
Newton and Erica Linard for helped with Cherry Farm cultures, lab inspection cleanings,
fish feedings, and were great support systems throughout graduate school. Sarah Au
helped with taking down experiments. Dr. Peter van den Hurk allowed me to use so many
instruments in his lab. Without his generosity, this work would not be possible. Dr.
Bridges provided statistical expertise on the wide variety of experiments. Dr. Nishanth
Tharayil and Amith Marioli are the reason I have most of my data and I was able to
complete this dissertation, thanks to their long hours and efforts on collaborating with the
LC-MS/MS. I can't thank both of you enough for your time and patience. Dr. Sandra
Gray allowed me to use your scintillation counter and offered to help in any way
possible. Dr. Eric Peatman generously provided help with identifying the SERT sequence
in the hybrid striped bass. Dr. Tara Sabo-Attwood and lab allowed me to come down to
the University of Florida and use many supplies and instruments as we collaborated on
the SERT sequencing. Thank you to the SETAC and CSETAC communities for travel
awards, research funding, the opportunities to gain experience presenting my research,
and providing valuable insight on my research.
Thank you to my parents, Gary and Liz. Words can't express my gratitude for the
loving support and opportunities you've provided my whole life to get me to this point. I
couldn't of done it without you. My brother Eric, you have been one of the most
supportive people in this process, and I will never be able to truly express how grateful I
am. I hope I can repay you in a few years with a very comfortable couch. To my future
sister in law, Lauren Hart, thank you for your interest, understanding, and support along
the way. Patrick Duffy, thank you for your patience; for your weekend trips that were
spent at Cherry Farm; for the hours you spent listening to presentations, when you had no
idea what I was talking about, but still sat through it and pretended to be interested. I
know I couldn't have done it without you. Thank you, Kuiper family, for being a second
family and cheering me on every step of the way. Thank you, Wyllie family, for
generously opening your Clemson home to me and including me in so many fun activities
during your visits. To my high school and college friends, you all are the greatest and
bring so much joy to my life. Thanks for your interest and support along the way.
TABLE OF CONTENTS
ACKNOWLEDGMENTS . vi
LIST OF TABLES . xii
LIST OF FIGURES . xiii
I. LITERATURE REVIEW .1
Pharmaceuticals in the Environment .1
Antidepressant Use and Route of Entry in the
Antidepressant Partitioning in the Environment .2
Mode of Action of Antidepressants .5
Role of Brain Chemistry in Behavior .9
Importance of Studying Behavior .10
Models to Predict Antidepressant Risk in the
Environment .13
Dissertation Goals .16
II. THE EFFECTS OF BUPROPION ON HYBRID STRIPED BASS
BRAIN CHEMISTRY AND PREDATORY BEHAVIOR .23
Introduction .23
Materials and Methods .26
Fish Culturing .26
HSB Training .27
Experimental Design .28
Chemicals and Reagents .29
Bupropion Exposure .29
Bupropion Analysis .31
Table of Contents (Continued)
Brain Monoamine Analysis .31
Instrumental Analysis .33
Statistical Analysis .34
Results and Discussion .35
Summary and Conclusions.39
III. IDENTIFICATION OF THE SEROTONIN REUPTAKE
TRANSPORTER (SERT) AND BINDING AFFINITY
ANTIDEPRESSANTS TO THE SERT IN THE HYBRID
STRIPED BASS .53
Introduction .53
Materials and Methods .55
Chemicals and Reagents .55
Identification of the SERT .56
Tissue Extraction .56
Primer Design .57
HSB Homogenate Binding Experiments .59
Statistical Analysis .61
Results and Discussion .61
SERT Sequencing .61
Brain Homogenate Binding Results .63
Conclusions .65
IV. BIOAVAILABILITY OF FLUOXETINE AND
VENLAFAXINE AS PREDICTORS OF
CHANGES IN BRAIN CHEMISTRY AND
PREDATORY BEHAVIOR IN THE HYBRID
STRIPED BASS .78
Introduction .78
Materials and Methods .80
Fish Culturing .80
HSB Training .81
Experimental Design .81
Experiment Chemicals .83
Fluoxetine and Venlafaxine Exposures .83
Water Analysis .84
Table of Contents (Continued)
Bioconcentration
Results and Discussion .87
Antidepressant Plasma and Brain Partitioning .88
Summary and Conclusions.94
V. THE EFFECTS OF AN ENVIRONMENTALLY
MIXTURE ON HYBRID STRIPED
BASS BRAIN CHEMISTRY AND PREDATORY
Introduction .107
Materials and Methods .109
Results and Discussion .115
Conclusions .121
VI. CONCLUSIONS.137
1.1 Highest reported concentrations of antidepressants in
the aquatic environment, as well as other tissues these
antidepressants have been detected in sampling events .3
2.1 Scheduled multiple reaction monitoring (sMRM)
parameters for bupropion exposure brain chemistry
3.1 Designed primers for standard PCR reactions and
RLM-RACE reactions .67
3.2 Comparison of the slc6a4 sequences to the HSB.68
3.3 The antidepressant binding affinity (Ki) to the HSB
brain homogenate .69
4.1 LC-MS/MS MRM optimization parameters for the
antidepressants and neurotransmitters in the brain and
plasma samples. 96
4.2 Aqueous, plasma, and brain concentrations of both fluoxetine
and venlafaxine after 3 days exposure to the HSB. 97
5.1 The dosing rational for the SSRI mixture treatments .123
5.2 Determination if the SSRI mixture was acting in an
additive manner in decreasing brain serotonin
concentrations .124
5.3 LC-MS/MS MRM optimization parameters for the
antidepressants and serotonin in the HSB brain mixture
2.1 The molecular struction of bupropion .43
2.2 The time to capture prey 1, 2, and 3 over the course of
the 12 day bupropion experiment .44
2.3 The dopaminergic pathway in vertebrate brains .45
2.4 Whole brain neurotransmitter concentrations
represented as a percent change from control
concentrations on day 3 of the bupropion experiment .46
2.5 Whole brain neurotransmitter concentrations
represented as a percent change from control
concentrations on day 6 of the bupropion experiment .48
3.1 Alignment of the HSB SERT sequence to the striped
bass SERT sequence .70
3.2 3' RACE HSB sequencing results aligned with the
striped bass SERT sequence .71
3.3 The functional domain of several vertebrate species'
slc6a4 proteins aligned .72
3.4 Saturation binding curve of [3H] citalopram to the SERT
in a HSB brain homogenate .74
4.1 The molecular structures of fluoxetine and venlafaxine .98
4.2 Fluoxetine plasma partitioning in the HSB over 72 hours .99
4.3 Brain fluoxetine partitioning after 6 hours and 72 hours
of aqueous exposure .100
4.4 Comparison of the plasma partitioning data with the
log D plasma model .101
4.5 Brain antidepressant concentrations as predictors of
change in brain serotonin .102
List of Figures (Continued)
4.6 Fluoxetine brain concentrations correlated with
time to capture prey by the HSB .103
4.7 Venlafaxine brain concentration correlated with
time to capture prey in the HSB .104
5.1 The molecular structures of fluoxetine, sertraline, and citalopram. 128
5.2 Time to capture prey 1 by HSB exposed to an
SSRI mixture .129
5.3 Time to capture prey 2 by HSB exposed to an
SSRI mixture .130
5.4 Time to capture prey 3 by HSB exposed to an
SSRI mixture .131
5.5 The percent change in brain serotonin concentrations
compared to controls in the HSB over a 12 day
exposure to an SSRI mixture .132
5.6 The decrease in brain serotonin concentrations on day 12
correlated with increase in time to capture prey 3 .133
5.7 The brain total SSRI concentrations over the 12 day
mixture experiment .134
CHAPTER ONE
LITERATURE REVIEW
Pharmaceuticals in the Environment
A national reconnaissance study performed from 1999-2000 by Kolpin et al. [1]
was one of the first to quantify pharmaceuticals and personal care products (PPCPs) in
over 139 streams across the United States. Over the counter and prescription
pharmaceuticals such as antibiotics, analgesics, steroids and hormones were just a few of
the compounds detected in the environment [1-4]. Personal care products used in every
day life, such as soaps, perfumes, disinfectants, and caffeine were also detected [1].
Advances in analytical chemistry and technology have provided the ability to be able to
quantify such a suite of compounds, many of which are detected in the part per trillion to
part per billion concentration range [1-4]. Among the many pharmaceuticals quantified
in the aquatic environment, the antidepressant pharmaceutical class will be the focus of
this dissertation.
Antidepressant Use and Route of Entry in the Environment
As of 2010, 47.5 % of the United States population takes at least one prescription
drug per month [5]. Antidepressant use has increased 400 % since 1988 and it is
estimated that 11% of Americans take antidepressants, making them the third most
commonly prescribed therapeutic class of pharmaceuticals [5]. Further, patients who take
antidepressants generally take them for a prolonged period of time, as 60 % of Americans
taking antidepressants have taken them for two or more years, while 14 % have taken
them for ten years or longer [5]. While these compounds have relatively short half lives,
typically 1-4 days, their metabolism can be quite variable among patients [6]. They
typically undergo extensive metabolism by cytochrome P450s to produce
pharmacologically active metabolites [6].
Therefore, widespread and prolonged use by humans results in the excretion of
these antidepressants and their active metabolites entering wastewater treatment plants
[7-13]. Primary treatment in the wastewater treatment process has a removal efficiency
ranging from 3.6-24% of antidepressants and their metabolites, while secondary
treatment (including activated sludge and biological nutrient removal) increased removal
efficiency to 5.8-53% [13]. Other studies have reported roughly 98% removal of the
antidepressant citalopram, 75-80% removal of fluoxetine, and 60% removal of sertraline
with tertiary treatment [14]. It was also noted that parent compounds were better removed
during all processes than the antidepressants' metabolites [15]. Therefore, increased
inputs of antidepressants and their metabolites into wastewater treatment plants that are
not equipped to completely remove these compounds results in many of these compounds
remaining in the final treated effluent. Though they have relatively short half lives, their
constant entry into and out of WWTP results in a constant input into the aquatic
environment. Their persistence and presence in the aquatic environment is evident, as
several studies have quantified antidepressants downstream of wastewater treatment
plants and in effluent-dominated streams [7-15].
Antidepressant Partitioning in the Environment
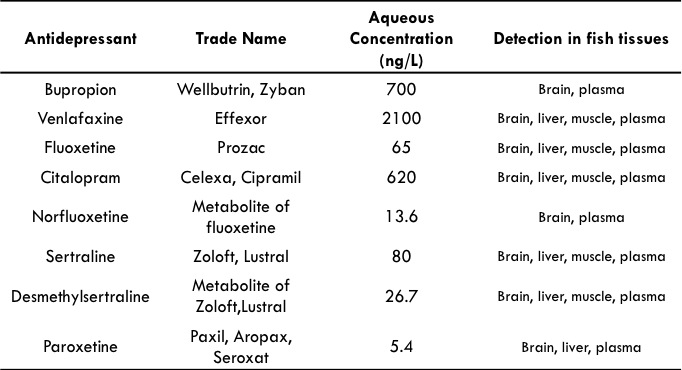
The main antidepressants detected in effluent-dominated streams are fluoxetine
(Prozac®), citalopram (Celexa®, Cipramil®), sertraline (Zoloft®, Lustral®) and paroxetine
(Paxil®), venlafaxine (Effexor®), and bupropion (Wellbutrin, Zyban®) . The highest
reported concentrations detected in the aquatic environment are summarized in Table 1.1
for each of these compounds.
Table 1.1. Highest reported antidepressant concentrations in effluent-impacted
streams across the United States.
Data taken from Schultz and Furlong, 2008; Schultz et al. 2010; Metcalfe et al. 2010;
Brooks et al. 2005; Lajeunesse et al., 2011.
Several studies have detected antidepressants in many aquatic organisms. The
proposed main route of uptake of antidepressants by aquatic organisms is assumed to be
via waterborne exposure over the gills. While the majority of studies have focused on
detecting antidepressants in fish tissues, antidepressants have also been detected in
aquatic species other than fish. Sertraline, fluoxetine, and their respective metabolites
were detected in periphyton and three taxa of invertebrates (Corbicula fluminea, Argia
sp., and hydropsychidae) [16]. Several SSRIs were detected in neonate bull shark plasma
(Carcharhins leucas) samples in effluent-impacted rivers in Florida [17].
Brooks et al. [7] sampled three resident fish species (Lepomis macrochirus
(bluegill), Ictalurus punctatus (channel catfish), and Pomoxis nigromaculatus (black
crappie)) in an effluent-dominated stream in Pecan Creek, Texas, for fluoxetine and
sertraline and their respective metabolites in brain, liver, and muscle tissues. The authors
found that the antidepressant concentrations were highest in the brain samples, followed
by the liver, then muscle. However, Lajeunesse et. al [9] found all antidepressant
concentrations to be highest in the liver, then brain, then muscle in mesocosm exposed
brook trout (Salvelinus fontinalis) to 20% effluent. Grabicova et al. [18] found tissue
partitioning to be different for each antidepressant in rainbow trout downstream of a
wastewater treatment plant in Sweden. All studies found the metabolites of
antidepressants to be significantly higher in all tissues than the parent compound.
Schultz et al. [10] quantified antidepressants in three different matrices (water,
sediment, and fish brains) in two effluent dominated streams in Colorado and Iowa.
Venlafaxine, citalopram, and bupropion had the highest concentrations in the water.
However, while venlafaxine was also highly detected in the sediment, citalopram and
bupropion were significantly lower in the sediment. Further, these partitioning trends
were not consistent in brain tissues, as the antidepressants fluvoxamine, norfluoxetine,
sertraline, and norsertraline were found to have the highest concentrations in white sucker
brains, though they had among the lowest concentrations in the water. Log Kow values of
these compounds did not reflect the observed trends; thus, mechanisms other than
hydrophobicity are driving the selective uptake of various antidepressants in brain tissue
[10]. Metcalfe et al. [19] found similar results with venlafaxine metabolite concentrations
exceeding 1 μg/L in water samples downstream of a sewage treatment plant, yet this
compound was not found to concentrate in caged fathead minnows (measured as whole
body). However, citalopram, sertraline, fluoxetine and their metabolites were found in
fish tissues in low concentrations, which were reflective of their low water
Thus, there is extensive evidence in the literature that antidepressants are not
completely removed from wastewater treatment processes. Antidepressants and their
metabolites have been detected in many rivers downstream of wastewater treatment
plants and in effluent dominated streams. Many differences have been observed in tissue
partitioning of antidepressants, and the partitioning trends are not always reflective of
aqueous concentrations. Overall, antidepressants are entering the aquatic environment
due to incomplete removal from wastewater treatment processes, partitioning into fish,
and ultimately reaching the brain where they are designed to alter brain chemistry.
Mode of Action of Antidepressants
Antidepressants are designed to target monoamine neurotransmission in the
central nervous system in humans. Neurotransmitters are released into the synaptic cleft
to relay signals between axons by binding to receptors on the postsynaptic membrane,
thereby activating intracellular messaging systems and relaying a signal from one axon to
the next [20-21]. This transmission is terminated either by enzyme degradation (via
monoamine oxidase (MAO) or catechol-O-methyltransferase (COMT)) or by removing
the neurotransmitter from the synapse by the reuptake transporters on the presynaptic
membrane, a means of recycling the neurotransmitters for later use [22]. Antidepressants
exert their effect by binding to the reuptake transporter and preventing the
neurotransmitter from being removed from the synaptic cleft, thus the neurotransmitters
remain in the synapse and continue their increased intracellular messaging. This
mechanism has been shown to be effective in treating depression, anxiety disorders, and
some personality disorders [20,22]. Selective serotonin reuptake inhibitors (SSRIs) bind
the serotonin reuptake transporter (SERT) and block reuptake of serotonin from the
synaptic cleft. Examples of SSRIs are fluoxetine (Prozac®), citalopram (Celexa®), and
sertraline (Zoloft®, Lustral®). Serotonin and norepinephrine reuptake inhibitors bind to
both SERTs and norepinephrine reuptake transporters, blocking reuptake of both
serotonin and norepinephrine from the synaptic cleft. Examples of SNRIs include
venlafaxine (Effexor®) and desvenlafaxine (Pristiq®). Lastly, norepinephrine and
dopamine reuptake inhibitors block both norepinephrine and dopamine reuptake
transporters, thereby preventing norepinephrine and dopamine from being removed from
the synaptic cleft. An example of an NDRI is bupropion (Wellbutrin®, Zyban®).
Since antidepressants are designed to alter brain chemistry in humans, they may
also be affecting aquatic organisms with similar neurological pathways. Evolutionary
conservation of the serotonin transporter has been demonstrated in both invertebrates and
vertebrates. The SERT in vertebrates is known as the slc6a4 gene representing the solute
carrier family 6, member 4 as a neurotransmitter transporter [23]. Mennigen et al. [23]
compared the sequencing of amino acids responsible for SSRI binding and found that fish
(specifically medaka, fugu, stickleback, goldfish, and zebrafish) displayed highly
conserved residues for SSRI binding to humans [23]. Further, two SERT sequences
(SERTa and SERTb) have been identified in Danio rerio and SERTa exhibits 70%
similarity to the human sequence [24]. Wang et al. overexpressed the zebrafish SERTa
sequence in a cell line to test the functionality of the transporter and found that
antidepressants blocked serotonin uptake into the cells, thus providing evidence that these
transporters are working similarly in zebrafish as they do in humans [24]. Mennigen [25]
identified the SERTa gene sequence for the serotonin reuptake transporter and found that
it is highly expressed in the goldfish brain and liver and had 98% identity to the zebrafish
serotonin reuptake transporter. These studies provide evidence that the target of
antidepressants is highly conserved in fish; however, this line of research in fish is
relatively limited at this time.
The antidepressant binding affinity has been quantified in rat brain homogenates
and human SERT transfected cell lines to provide insights into predicting side effects and
clinical profiles of these drugs [26-29]. While there is extensive knowledge on the effects
of SSRIs in mammalian brains, little is known on how these compounds interact with fish
brains. Wang et al. [24] identified the serotonin reuptake transporter in the zebrafish and
examined the functionality of the transporter by studying serotonin transport by the SERT
in the presence and absence of an antidepressant. The functionality of the SERT in the
transport of serotonin was the same as in humans and the antidepressant reduced the
transport of serotonin [24]. Gould et al. [30] quantified the binding affinity of a few
antidepressants and pesticides to the serotonin reuptake transporter (SERT) in both the
fathead minnow and golden shiner minnow. The authors found that the affinity of [3H]
citalopram for the serotonin reuptake transporter (SERT) in both the golden shiner
minnow and the fathead minnow was about 5 fold lower than in the rat [30]. The affinity
of the SSRIs for the minnow serotonin reuptake transporter binding site was anywhere
from 30-160 fold lower than observed in rat or humans, but overall had a similar
pharmacological profile to mammals [30]. Valenti et al. [31] investigated changes in the
SERT-like binding sites in the fathead minnow, after a 21 day exposure to the SSRI
sertraline. The authors found a significant decrease in the number of SERT-like binding
sites, suggesting a possible down regulation of SERT transporters with chronic SSRI
exposure. The authors also found that the decrease in SERT-like binding correlated with
a change in shelter seeking behavior in fathead minnow males [31]. These are the only
studies to my knowledge that have quantified SSRI binding to the serotonin reuptake
transporter in fish or have investigated the effects of SSRIs on SERT densities, which
would ultimately impact the potency of SSRI binding in the brain. Since the
antidepressant binding affinity in rat brain homogenates and human transfected cell lines
has provided insights into predicting side effects and clinical profiles of various drugs
[29], further elucidation of the binding affinity of SSRIs in more fish species may provide
valuable insight in predicting potentially adverse effects of SSRIs in these nontarget
Role of Brain Chemistry in Behavior
Monoamine neurotransmitters have been shown to play a major role in
physiological functions and behaviors. In humans, serotonin has been shown to be
involved with cardiovascular regulation, respiration, circadian rhythm, appetite, stress,
and learning behaviors [32-33]. Norepinephrine is involved in stress responses,
specifically the flight or fight response [34]. Dopamine is typically thought to be involved
in locomotion, aggression, and emotional rewards [33,35]. While they individually play
roles in certain behaviors, it is also likely that multiple neurotransmitters play a role in a
variety of behaviors [22, 33, 35].
In fish, serotonin is involved in stress reactions, dominance hierarchies, locomotor
activity, and aggressive behavior [33], as well as in physiological processes such as
neuroendocrine regulation and reproduction [23, 36). Increased serotonin has been shown
to have an inhibitory effect on aggressive behaviors and feeding [35]. However, there is
also evidence of decreased brain serotonin concentrations correlating with increased time
to capture prey and an overall decreased appetite in fish [37-39]. The ratio of serotonin's
metabolite, 5-hydroxyindoleacetic acid (5-HIAA), to serotonin has been shown to be
increased during periods of food deprivation, as well as in stressed and subordinate fish
Dopamine is also involved in aggressive and dominance behaviors [31]. Increased
dopamine and decreased norepinephrine concentrations have been found in dominant
rainbow trout, while subordinate fish were found to have lower concentrations of
dopamine than controls [42]. Norepinephrine and epinephrine, two of dopamine's
metabolites, have been involved in stress responses, feeding, locomotor activities, and
social hierarchies [35, 43-45], which are many of the same behaviors associated with
serotonin and dopamine. Therefore, it is clear to see there is a lot of overlap between the
role of various monoamines and their metabolites on different behaviors and
physiological functions; however, more research is needed to gain a clearer
understanding of how antidepressants may alter monoamines in nontarget organisms, and
how these changes in brain chemistry may elicit alterations in behavior.
Importance of Studying Behavior
Standard acute toxicity testing has revealed that sertraline is the most toxic
antidepressant to all tested trophic levels (algae, invertebrates, amphibians, and fish). The
acute lethality (LC50) for all antidepressants ranges from high μg/L to low mg/L
concentrations, which is much higher than the concentrations found in the aquatic
environment [46, 47-50]. However, there is evidence that antidepressants can cause
sublethal effects, such as altered behavior.
The study of behavior provides an important link between the physiology of the
organism and its ecology. Fish provide an excellent test organism for behavior, as they
have high ecological relevance and are susceptible to environmental stressors due to
constant contact with the aquatic environment [51]. Currently, avoidance behavior is the
only accepted behavior to provide legal evidence of injury for the Natural Resource
Damage Assessment (NRDA) [51]. Behavior has been slow to be integrated into
toxicological assessments due to a lack of data reproducibility and the inability to
translate alterations in behavior to ecological issues. However, with advanced
technologies in many recording, software programs, and experimental designs, behaviors
such as swimming patterns, intra and inter-specific interactions, respiratory patterns, and
reproductive behaviors have been investigated upon exposure to various stressors.
Field evidence of SSRIs concentrating and reaching the intended site of action in
aquatic organisms has provided a need to investigate the impacts of SSRIs on endpoints
that may not cause effects in commonly studied acute and chronic endpoints, but could
exert sublethal effects and alter an organism's fitness. To be ecologically fit, an organism
needs to capture food, avoid predation, and reproduce. There have been several studies
investigating the effects of antidepressants on each of these important factors to be
considered ecologically fit.
Exposure to venlafaxine increased foot detachment in a freshwater snail, C.
funebralis, which may have a sublethal effect through transporting the snail to
unfavorable habitats, or increasing the risk of predation [52]. Larval fathead minnows
exposed to environmentally relevant mixtures (ng/L) of four different antidepressants
showed a delay in predator avoidance [53], suggesting that an organism's ability of
avoiding predation may be affected by SSRIs in the aquatic environment.
Hybrid striped bass exposed to fluoxetine (an SSRI) and venlafaxine (an SNRI)
individually displayed increased time to capture prey while exhibiting decreased brain
serotonin concentrations [37-38]. Similarly, male fathead minnows exposed to 10 and
100 ug/L fluoxetine increased the time it took the minnows to eat 10 D.magna, with those
fish exposed to 100 ug/L had a significant increase in time to find prey even after being
placed in a clean system for 2 weeks [54]. Further, hybrid striped bass exposed to a
mixture of fluoxetine and venlafaxine showed additive effects in decreased brain
serotonin levels and increased time to capture prey at low mixture exposures [43]. A
study examining the effects of decreased food intake in goldfish when exposed to
fluoxetine found that goldfish exposed to 54 ug/L lost weight while control fish gained
weight [25]. These studies suggest that antidepressants alter an organism's ability to
capture food, to the point of causing significant differences in the size of exposed and
unexposed organisms. The results of not being able to capture food may translate into
energetic issues that may also affect an organism's ability to reproduce.
The effects of antidepressants on reproductive behavior have also been studied.
Male blue headed wrasse showed decreased territorial aggressive behavior upon exposure
to environmentally relevant concentrations of fluoxetine [55], while male fathead
minnows exposed to higher than environmentally relevant concentrations of fluoxetine
showed increased aggression towards females [54]. Valenti et al. [31] found that
exposure to sertraline (an SSRI) resulted in altered nest guarding behavior in fathead
minnows, as males exhibited a decreased time spent in shelters upon exposure to
sertraline [31], but fluoxetine exposure to male fathead minnows increased the time they
spent under the tiles compared to controls [49]. The fluoxetine exposed males also spent
more time cleaning their tiles [49]. Exposure to fluoxetine at 300 ug/L-3000 ug/L caused
the Ellipto complanta mussel for 48 hours to release a significantly increased amount of
nonviable glochidia, the larval stage of freshwater mussels [56]. These reproductive
behavior studies provide evidence of potential population level effects of exposure to
SSRIs, with altered reproductive behaviors occurring due to exposure to these drugs.
Overall, all of these studies provide evidence that the presence of SSRIs in the
aquatic environment can alter fitness related behaviors, resulting in survival implications
of individuals that can translate into effects at the population level. However,
antidepressants are entering the environment in complex mixtures, with several
compounds possessing the same mechanism of action and metabolites exerting similar
potencies to the target receptor as the parent compounds. Few studies have focused on
environmentally relevant mixtures of these compounds on sublethal endpoints, such as
behavior. Therefore, to further understand the risk of these mixtures in the environment,
more research is needed in this area.
Models to Predict Antidepressant Risk in the Environment
The European Agency for the Evaluation of Medicinal Products requires an
environmental risk assessment to integrate toxicology, mechanism of action, and any
information provided in marketing packages for an adequate assessment of potential
adverse ecotoxicological effects when a new drug is being registered [57]. Currently,
there are no such requirements for pharmaceutical companies in the United States.
However, pharmaceutical companies do perform a variety of in vitro and in vivo studies
to develop a nonclinical safety profile for registration of a pharmaceutical and use in
patients. Therefore, the amount of mammalian data available on many pharmaceuticals is
quite extensive and there have been a few proposed models to integrate the mammalian
data to better prioritize pharmaceuticals that may cause adverse ecotoxicological effects.
Though SSRI antidepressants display similar mechanisms of action, each drug has
slightly different chemical structures, pharmacokinetic properties, and metabolism [20].
One common structural similarity of all antidepressants is an amine functional group,
closely resembling their serotonin, norepinephrine, and other monoamine
neurotransmitters targets. Due to the presence of an amine group, these drugs are weak
bases and ionizable compounds across environmental pH levels. Thus, it is important to
take into consideration exposure pH in studying the uptake and toxicity of these
antidepressant drugs. The sertraline EC10 values for growth and feeding rate in the
fathead minnow (P. promelas) differed by an order of magnitude for pH values in the 6.5
to 8.5 range [46]. Nakamura et al. [58] also found a 27.5 fold difference in 96 hour
fluoxetine LC50 values for Japanese medaka (Oryzias latipes) between pH 7 and pH 9.
The first models predicting compound partitioning were based upon a
compound's log Kow and aqueous concentration. Huggett et al. [59] created a revised
model from a plasma bioconcentration model by Fitzsimmons et al. [60] to predict the
partitioning from the aqueous phase to the arterial blood with the following equation,
Log PBlood:water = 0.73 * Log Kow – 0.88
where Log PBlood:water is the predicted partitioning of the antidepressant from the aqueous
environment into the fish blood and the Log Kow is the octanol:water coefficient of the
antidepressant [60].
From the above equation, Huggett et al. [59] further developed the following equation to
predict fish plasma concentrations from aqueous exposure (Fishplasma):
Fishplasma= [Aqueous] * PBlood:water
where Fishplasma is the predicted antidepressant concentration in the plasma of the fish,
[Aqueous] is the antidepressant concentration in the aqueous solution, and PBlood:water the
predicted partitioning of the antidepressant from the aqueous environment into the fish
arterial blood [59].
However, equation 4 was not sufficient to predict ionizable compounds, such as
antidepressants, as has also been noted in a variety of field sampling studies [7-10,15,
17]. Thus, Valenti et al. [31] altered the model proposed by Fitzsimmons et al. [60] and
Huggett et al. [59] to account for site-specific pH effects on bioavailability by using log
D rather than log Kow in the model. Log D is commonly used in pharmaceutical research,
as it quantifies the distribution of a drug at various pH values. Therefore, Valenti et al.
[31] altered the equation to include the Log D of a compound:
Log PBlood:water = 0.73 * Log Doct:water – 0.88
Valenti et al. [31] was able to predict fish plasma concentrations from mean aqueous
sertraline (an SSRI antidepressant) (equation 5) exposures by using the log Doct:water for
sertraline, to yield a predicted vs. actual regression with an R2=0.98. Equation 5 has only
been validated on one ionizable compound, sertraline. Further validation of Valenti et
al.'s model will be useful in predicting the partitioning of antidepressants into fish
plasma. Once the plasma concentration has been determined in fish, a comparison
between the human therapeutic plasma concentration and the fish plasma concentration
can be made. Huggett et al. proposed utilizing an effect ratio using the equation [57]:
Where ER is the effect ratio, HTPC is the human therapeutic plasma concentration, and
FSSPC is the steady state fish plasma concentration [57]. An effect ratio of less than or
equal to one indicates that the fish plasma concentration is equal or greater than the
human therapeutic plasma concentration, and the possibility to exert a response in the fish
is high. If the effect ratio is greater than one, this suggests the fish plasma concentration
is less than the therapeutic human concentration and a response from the pharmaceutical
is less likely. Equation 6 has provided valuable and logical insight into utilizing existing
data to make prioritization decisions for further studies determining ecological risk.
Overall, validating these models with more antidepressants is necessary. Further, these
models represent the most up to date predictive models in the pharmaceutical literature.
There are currently no models predicting specific adverse effects (i.e. behavioral
changes) in the literature; the most predictive are those developed by Huggett et al. [57]
and Valenti et al. [31].
Dissertation Goals
The overall goal of this dissertation was to gain a better understanding of how
antidepressants alter brain chemistry and behavior in the hybrid striped bass. To achieve
the goal, the first objective was to further our understanding of the relationship between
neurotransmitters and predatory behavior, and prioritize the therapeutic class of
antidepressants to focus my work. Next, I wanted to identify the target of SSRI
antidepressants in the hybrid striped bass. I also wanted to gain a better understanding of
the bioavailability of these compounds to the hybrid striped bass, as well as quantify the
antidepressant binding to the target receptor in the hybrid striped bass brain. Lastly, I
wanted to quantify the effects of an environmentally relevant mixture of antidepressants
on hybrid striped bass brain chemistry and predatory behavior. Thus, I accomplished
these goals by the following objectives:
1. Determined the effects of bupropion, a norepinephrine and dopamine reuptake
inhibitor (NDRI) antidepressant, on hybrid striped bass brain chemistry and
predatory behavior.
2. Identified the target of SSRI antidepressants, the serotonin reuptake transporter, in
the hybrid striped bass and quantify the binding affinity of various antidepressants
to the serotonin reuptake transporter in the hybrid striped bass brain.
3. Quantified the bioavailability of fluoxetine and venlafaxine, two previously
studied antidepressants that have caused adverse effects on brain chemistry and
behavior, through plasma and brain antidepressant concentrations.
4. Determined the effects of an environmentally relevant SSRI mixture on hybrid
striped bass brain chemistry and predatory behavior.
CITATIONS
1. Kolpin, D. W., Furlong, E. T., Meyer, M. T., Thurman, E. M., Zaugg, S. D.,
Barber, L. B., & Buxton, H. T. (2002). Pharmaceuticals, hormones, and other
organic wastewater contaminants in US streams, 1999-2000: A national
reconnaissance. Environmental Science & Technology, 36(6), 1202-1211.
2. Heberer,T.(2002).Occurrence, fate, and removal of pharmaceutical residues in
the aquatic environment: a review of recent research data. Toxicol. Lett. 131, 5–17
3. Kummerer, K. (2001). Drugs, diagnostic agents and disinfectants in waste water
and water—a review. Chemosphere 45, 957–69.
4. Kummerer, K. (2009). Pharmaceuticals from human use in the environment—
present knowledge and future challenges. J. Environ. Manag. 90, 2354–66.
5. Pratt LA, Brody DJ, Gu Q. 2011. Antidepressant use in persons aged 12 and over:
United States, 2005–2008. NCHS data brief, no 76. National Center for Health
Statistics, Hyattsville, MD.
6. Hiemke, C., & Härtter, S. (2000). Pharmacokinetics of selective serotonin
reuptake inhibitors. Pharmacology & Therapeutics, 85(1), 11-28.
7. Brooks, B. W., Chambliss, C. K., Stanley, J. K., Ramirez, A., Banks, K. E.,
Johnson, R. D., & Lewis, R. J. (2005). Determination of select antidepressants in
fish from an effluent‐dominated stream. Environmental Toxicology & Chemistry,
24(2), 464-469.
8. Ramirez, A. J., Brain, R. A., Usenko, S., Mottaleb, M. A., O'Donnell, J. G., Stahl,
L. L., Wathen, J.B., Snyder, B.D., Pitt, J.L., Perez‐Hurtado, P., Dobbins, L.L.,
Brooks, B.W., & Chambliss, C.K. (2009). Occurrence of pharmaceuticals and
personal care products in fish: Results of a national pilot study in the United
States. Environmental Toxicology and Chemistry, 28(12), 2587-2597.
9. Lajeunesse, A., Gagnon, C., Gagné, F., Louis, S., Čejka, P., & Sauvé, S. (2011).
Distribution of antidepressants and their metabolites in brook trout exposed to
municipal wastewaters before and after ozone treatment–Evidence of biological
effects. Chemosphere, 83(4), 564-571.
10. Schultz, M. M., Furlong, E. T., Kolpin, D. W., Werner, S. L., Schoenfuss, H. L.,
Barber, L. B., Blazer, V.S., Norris, D.O., & Vajda, A. M. (2010). Antidepressant
pharmaceuticals in two US effluent-impacted streams: Occurrence and fate in
water and sediment, and selective uptake in fish neural tissue. Environmental
Science & Technology, 44(6), 1918-1925.
11. Schultz, M. M., & Furlong, E. T. (2008). Trace analysis of antidepressant
pharmaceuticals and their select degradates in aquatic matrixes by
LC/ESI/MS/MS. Analytical Chemistry, 80(5), 1756-1762.
12. Gómez, M. J., Petrović, M., Fernández-Alba, A. R., & Barceló, D. (2006).
Determination of pharmaceuticals of various therapeutic classes by solid-phase
extraction and liquid chromatography–tandem mass spectrometry analysis in
hospital effluent wastewaters. Journal of Chromatography A, 1114(2), 224-233.
13. Vasskog, T., Anderssen, T., Pedersen-Bjergaard, S., Kallenborn, R., & Jensen, E.
(2008). Occurrence of selective serotonin reuptake inhibitors in sewage and
receiving waters at Spitsbergen and in Norway. Journal of Chromatography A,
1185(2), 194-205.
14. Styrishave, B., Halling‐Sørensen, B., & Ingerslev, F. (2011). Environmental risk
assessment of three selective serotonin reuptake inhibitors in the aquatic
environment: a case study including a cocktail scenario. Environmental
Toxicology and Chemistry, 30(1), 254-261.
15. Lajeunesse, A., Smyth, S., Barclay, K., Sauvé, S., & Gagnon, C. (2012).
Distribution of antidepressant residues in wastewater and biosolids following
different treatment processes by municipal wastewater treatment plants in Canada.
Water Research, 46(17), 5600-5612.
16. Daughton CG and Brooks BW. "Active Pharmaceutical Ingredients and Aquatic
Organisms," In: Environmental Contaminants in Biota: Interpreting Tissue
Concentrations, W. Nelson Beyer and James P. Meador (Eds.), 2nd ed., CRC
Press, Taylor and Francis, Boca Raton, FL; Chapter 8, p 286-347, 2011.
17. Gelsleichter, J., & Szabo, N. J. (2013). Uptake of human pharmaceuticals in bull
sharks (Carcharhinus leucas) inhabiting a wastewater-impacted river. Science of
the Total Environment, 456, 196-201.
18. Grabicova, K., Lindberg, R. H., Östman, M., Grabic, R., Randak, T., Larsson, D.
J., & Fick, J. (2014). Tissue-specific bioconcentration of antidepressants in fish
exposed to effluent from a municipal sewage treatment plant. Science of the Total
Environment, 488, 46-50.
19. Metcalfe, C. D., Chu, S., Judt, C., Li, H., Oakes, K. D., Servos, M. R., &
Andrews, D. M. (2010). Antidepressants and their metabolites in municipal
wastewater, and downstream exposure in an urban watershed. Environmental
Toxicology & Chemistry, 29(1), 79-89.
20. Kreke, N., & Dietrich, D. R. (2008). Physiological endpoints for potential SSRI
interactions in fish. CRC Critical Reviews in Toxicology, 38(3), 215-247.
21. Boyer, E. W., & Shannon, M. (2005). The serotonin syndrome. New England
Journal of Medicine, 352(11), 1112-1120.
22. Mayze, T. 2012. How antidepressants work. CNS Forum, 6. Retrieved from
23. Mennigen, J. A., Stroud, P., Zamora, J. M., Moon, T. W., & Trudeau, V. L.
(2011). Pharmaceuticals as neuroendocrine disruptors: Lessons learned from fish
on Prozac. Journal of Toxicology & Environmental Health, Part B, 14(5-7), 387-
24. Wang, Y., Takai, R., Yoshioka, H., & Shirabe, K. (2006). Characterization and
expression of serotonin transporter genes in zebrafish. Tohoku Journal of
Experimental Medicine, 208(3), 267-274.
25. Mennigen, J. A., Sassine, J., Trudeau, V. L., & Moon, T. W. (2010). Waterborne
fluoxetine disrupts feeding and energy metabolism in the goldfish Carassius
auratus. Aquatic Toxicology, 100(1), 128-137.
26. Richelson, E. (1994). Pharmacology of antidepressants—characteristics of the
ideal drug. Paper presented at the Mayo Clinic Proceedings, 69(11) 1069-1081.
27. Sánchez, C., & Hyttel, J. (1999). Comparison of the effects of antidepressants and
their metabolites on reuptake of biogenic amines and on receptor binding.
Cellular and Molecular Neurobiology, 19(4), 467-489.
28. Baumann, P. (1996). Pharmacology and pharmacokinetics of citalopram and other
SSRIs. International Clinical Psychopharmacology, 11 Suppl 1, 5-11.
29. Owens, M. J., Morgan, W. N., Plott, S. J., & Nemeroff, C. B. (1997).
Neurotransmitter receptor and transporter binding profile of antidepressants and
their metabolites. The Journal of Pharmacology & Experimental Therapeutics,
283(3), 1305-1322.
30. Gould, G. G., Brooks, B. W., & Frazer, A. (2007). [3H] citalopram binding to
serotonin transporter sites in minnow brains. Basic & Clinical Pharmacology &
Toxicology, 101(3), 203-210.
31. Valenti Jr, T. W., Gould, G. G., Berninger, J. P., Connors, K. A., Keele, N. B.,
Prosser, K. N., & Brooks, B. W. (2012). Human therapeutic plasma levels of the
selective serotonin reuptake inhibitor (SSRI) sertraline decrease serotonin
reuptake transporter binding and shelter-seeking behavior in adult male fathead
minnows. Environmental Science & Technology, 46(4), 2427-2435.
32. Lucki, I. (1998). The spectrum of behaviors influenced by serotonin. Biological
psychiatry, 44(3), 151-162.
33. Campbell, N. A., & Reece, J. B. (2002). In Wilbur B. (Ed.), Biology (Sixth
Edition ed.). San Francisco, CA, USA: Pearson Education, Inc.
34. Morilak, D. A., Barrera, G., Echevarria, D. J., Garcia, A. S., Hernandez, A., Ma,
S., & Petre, C. O. (2005). Role of brain norepinephrine in the behavioral response
to stress. Progress in Neuro-Psychopharmacology and Biological Psychiatry,
29(8), 1214-1224.
35. Winberg, S., & Nilsson, G. E. (1993). Roles of brain monoamine
neurotransmitters in agonistic behaviour and stress reactions, with particular
reference to fish. Comparative Biochemistry and Physiology Part C:
Pharmacology, Toxicology and Endocrinology, 106(3), 597-614.
36. Brodin, T., Piovano, S., Fick, J., Klaminder, J., Heynen, M., & Jonsson, M.
(2014). Ecological effects of pharmaceuticals in aquatic systems—impacts
through behavioural alterations. Philosophical Transactions of the Royal Society
B: Biological Sciences, 369(1656), 20130580.
37. Gaworecki, K. M., & Klaine, S. J. (2008). Behavioral and biochemical responses
of hybrid striped bass during and after fluoxetine exposure. Aquatic Toxicology,
88(4), 207-213.
38. Bisesi Jr, J. H., Bridges, W., & Klaine, S. J. (2014). Effects of the antidepressant
venlafaxine on fish brain serotonin and predation behavior. Aquatic Toxicology,
148, 130-138.
39. Bisesi Jr. JH, Sweet LE, van den Hurk P, Klaine SJ. (Accepted 2015). Effects of
an antidepressant mixture on the brain chemistry and predatory behavior of hybrid
striped bass. Environmental Toxicology & Chemistry.
40. Winberg, S., Nilsson, G. E., & Olsén, K. H. (1991). Social rank and brain levels
of monoamines and monoamine metabolites in arctic charr, Salvelinus alpinus
(L.). Journal of Comparative Physiology A, 168(2), 241-246.
41. Winberg, S., Nilsson, G. E., & Olsén, K. H. (1992). Changes in brain serotonergic
activity during hierarchic behavior in Arctic charr (Salvelinus alpinus L.) are
socially induced. Journal of Comparative Physiology A, 170(1), 93-99.
42. McIntyre, D. C., Healy, L. M., & Saari, M. (1979). Intraspecies aggression and
monoamine levels in rainbow trout (Salmo gairdneri) fingerlings. Behavioral and
Neural Biology, 25(1), 90-98.
43. Pouliot, T., & De la Noue, J. (1989). Feed intake, digestibility and brain
neurotransmitters of rainbow trout under hypoxia. Aquaculture, 79(1), 317-327.
44. de Pedro, N., Martinez-Alvarez, R., & Delgado, M. J. (2006). Acute and chronic
leptin reduces food intake and body weight in goldfish (Carassius auratus). The
Journal of Endocrinology, 188(3), 513-520. doi:188/3/513 [pii]
45. Hoglund, E., Balm, P. H., & Winberg, S. (2002). Behavioral and neuroendocrine
effects of environmental background colour and social interaction in arctic charr
(Salvelinus alpinus). The Journal of Experimental Biology, 205(Pt 16), 2535-
46. Valenti, T. W., Perez‐Hurtado, P., Chambliss, C. K., & Brooks, B. W. (2009).
Aquatic toxicity of sertraline to Pimephales promelas at environmentally relevant
surface water pH. Environmental Toxicology and Chemistry, 28(12), 2685-2694.
47. Brausch, J. M., Connors, K. A., Brooks, B. W., & Rand, G. M. (2012). Human
pharmaceuticals in the aquatic environment: A review of recent toxicological
studies and considerations for toxicity testing. Reviews of Environmental
Contamination & Toxicology. 218:1-99. Springer.
48. Henry, T. B., Kwon, J., Armbrust, K. L., & Black, M. C. (2004). Acute and
chronic toxicity of five selective serotonin reuptake inhibitors in Ceriodaphnia
dubia. Environmental Toxicology and Chemistry, 23(9), 2229-2233.
49. Richards, S. M., & Cole, S. E. (2006). A toxicity and hazard assessment of
fourteen pharmaceuticals to Xenopus laevis larvae. Ecotoxicology, 15(8), 647-
50. Christensen, A. M., Faaborg‐Andersen, S., Flemming, I., & Baun, A. (2007).
Mixture and single‐substance toxicity of selective serotonin reuptake inhibitors
toward algae and crustaceans. Environmental Toxicology and Chemistry, 26(1),
51. Kane, A., Salierno, J., & Brewer, S. (2005). Fish models in behavioral toxicology:
Automated techniques, updates and perspectives. Methods in Aquatic Toxicology,
2, 559-590.
52. Fong, P. P., & Molnar, N. (2013). Antidepressants cause foot detachment from
substrate in five species of marine snail. Marine Environmental Research, 84, 24-
53. Painter MM, Buerkley MA, Julius ML, Vajda AM, Norris DO, Barber LB. 2009.
Antidepressants at environmentally relevant concentrations affect predator
avoidance behavior of larval fathead minnows (Pimephales promelas).
Environmental Toxicology and Chemistry 28: 2677-2684.
54. Weinberger II, J., & Klaper, R. (2014). Environmental concentrations of the
selective serotonin reuptake inhibitor fluoxetine impact specific behaviors
involved in reproduction, feeding and predator avoidance in the fish Pimephales
promelas (fathead minnow). Aquatic Toxicology, 151, 77-83.
55. Perreault, H. A., Semsar, K., & Godwin, J. (2003). Fluoxetine treatment decreases
territorial aggression in a coral reef fish. Physiology & Behavior, 79(4), 719-724.
56. Bringolf, R. B., Heltsley, R. M., Newton, T. J., Eads, C. B., Fraley, S. J., Shea, D.,
& Cope, W. G. (2010). Environmental occurrence and reproductive effects of the
pharmaceutical fluoxetine in native freshwater mussels. Environmental
Toxicology and Chemistry, 29(6), 1311-1318.
57. Huggett, D., Ericson, J., Cook, J., & Williams, R. (2004). Plasma concentrations
of human pharmaceuticals as predictors of pharmacological responses in fish.
Pharmaceuticals in the Environment (pp. 373-386) Springer.
58. Nakamura, Y., Yamamoto, H., Sekizawa, J., Kondo, T., Hirai, N., & Tatarazako,
N. (2008). The effects of pH on fluoxetine in japanese medaka (Oryzias latipes):
Acute toxicity in fish larvae and bioaccumulation in juvenile fish. Chemosphere,
70(5), 865-873.
59. Huggett, D., Cook, J., Ericson, J., & Williams, R. (2003). A theoretical model for
utilizing mammalian pharmacology and safety data to prioritize potential impacts
of human pharmaceuticals to fish. Human and Ecological Risk Assessment, 9(7),
60. Fitzsimmons, P. N., Fernandez, J. D., Hoffman, A. D., Butterworth, B. C., &
Nichols, J. W. (2001). Branchial elimination of superhydrophobic organic
compounds by rainbow trout (Oncorhynchus mykiss). Aquatic Toxicology, 55(1),
CHAPTER TWO
THE EFFECTS OF BUPROPION ON HYBRID STRIPED BASS BRAIN
CHEMISTRY AND PREDATORY BEHAVIOR
Introduction
Antidepressant use has increased 400 percent since 1988, making them the third
most commonly prescribed therapeutic class of pharmaceuticals in the US [1]. Due to this
widespread and prolonged use, antidepressants are entering waste water treatment plants.
Currently, most wastewater treatment plants do not completely remove these materials;
thus, antidepressants are among the most prevalently detected pharmaceuticals in stream
samples that receive final treated wastewater effluent [1,2,3]. Most antidepressant
concentrations detected in rivers downstream of wastewater treatment plant outfalls are
individually in the low ng/L range in North America [3,4,5,6]; however, the
concentrations of the metabolite of venlafaxine, O-desmethylvenlafaxine have been
detected as high as 2.1 μg/L in untreated wastewater [6].
Since antidepressants are designed to target monoamine neurotransmission in the central
nervous system of humans, the presence of these drugs in the aquatic environment may
cause adverse effects to aquatic organisms. Brain monoamines, including dopamine,
norepinephrine, epinephrine, and serotonin, are highly conserved, and their metabolism is
believed to be the same in all vertebrates [7,8]. Antidepressants bind to reuptake
transporters on the presynaptic neuron to prevent neurotransmitters from being removed
from the synapse. The mechanism theoretically increases neurotransmission signaling in
the synapse [8,9]. Selective serotonin reuptake inhibitors (SSRIs), serotonin and
norepinephrine reuptake inhibitors (SNRIs), and norepinephrine and dopamine reuptake
inhibitor (NDRIs) antidepressants are among the most currently prescribed antidepressant
classes, and they are marketed to target the respective neurotransmitter reuptake
transporter as indicated in the name.
Previous research has shown that hybrid striped bass (HSB) (Morone saxatilis x.
Morone chrysops) exposed to fluoxetine, a SSRI antidepressant, for 6 d in a static system
decreased brain serotonin concentrations in the HSB with a subsequent increase in time
to capture prey [10]. After a 6 d recovery period, both the HSB brain serotonin
concentrations and time to capture prey did not return to control levels [10]. Using the
same experimental design, HSB exposed to venlafaxine, a SNRI, also decreased brain
serotonin concentrations in the HSB after 6 d of exposure, and HSB exhibited an increase
in time to capture prey [11]. Although venlafaxine is marketed to target brain serotonin
and norepinephrine in humans, brain norepinephrine concentrations were not altered in
the HSB exposed to venlafaxine in the study [11]. After a 6 d recovery period, the brain
serotonin concentrations and the time it took the HSB to capture the first two (of the four
minnows) returned to control levels [11]. These previous studies suggested that when
antidepressant exposure altered brain serotonin concentrations in the HSB, time to
capture prey was subsequently increased. However, it is noted that many
neurotransmitters are involved in a variety of behaviors. Serotonin has been shown to be
involved in territorial behavior [12], reproduction [13], appetite [14], decreased
locomotor activity [7], stress [7] and immune function [15] in fish. Dopamine has been
shown to be involved in stimulating aggressive behavior [16] and dominance behaviors
[7] in fish. Therefore, the purpose of this study was to investigate the effects of bupropion
(Figure 2.1), an NDRI antidepressant, on HSB brain chemistry and behavior. Bupropion,
a NDRI antidepressant and smoking cessation aid known commonly as Wellbutrin® or
Zyban®, is among the top 200 most prescribed pharmaceuticals [17]. Bupropion has been
detected in effluent dominated streams at concentrations as high as 227 ng/L [3], and has
also been found to accumulate in fish tissues, specifically fathead minnow brain tissues
[3,18] providing evidence that bupropion is reaching its intended site of action in fish.
The majority of studies examining the effects of antidepressants in the aquatic
environment focus on the SSRI and SNRI class of antidepressants, thus there are few
studies on the effects of NDRIs on aquatic organisms. Adult male fathead minnows
exposed to environmentally relevant bupropion concentrations for 21 days did not alter
their survival compared to controls [18]. However, Painter et al. (2009) found that
bupropion exposure to larval fathead minnows caused a decreased escape velocity and
total predator escape response [19]. The objectives of this study of the dissertation were
to (1) quantify the effects of bupropion on a suite of brain neurotransmitter
concentrations in fish and (2) quantify the effects of bupropion on a predator's ability to
capture prey, measured through time to capture prey. To my knowledge, this is the first
study to examine the effects of bupropion on fish brain chemistry. Although the study
does not mimic environmentally relevant scenarios, it will further elucidate an important
relationship in fish between alteration of the brain neurotransmitter concentrations and
the ability of a predator to capture prey.
Materials and Methods
Fish Culturing
Hybrid striped bass (Morone saxatilis x. Morone chrysops) were generously
donated by Southland Fisheries (Colombia, SC, USA). HSB were cultured in 450 L tanks
operated in a flow through mode using water from adjacent Lake Hartwell (Clemson, SC,
USA; pH 6.28 + 0.17, total hardness 24 mg/L as CaCO3, total alkalinity 10 mg/L as
CaCO3). The Cherry Farm aquatic facility at Clemson University continually pumps fresh
water from Lake Hartwell into a head pond. The water then undergoes gravel filtration
and UV sterilization before entering the aquatic facility. An inline heater and chiller
maintained water temperatures between 21 and 25°C. HSB were fed pelleted feed
(Zeigler Brothers, Inc) until they were large enough to eat fathead minnows. Fathead
minnows (P. promelas) were purchased from Anderson Minnow Farm (Lonoke, AR,
USA) and were cultured in 100 L troughs, in the same facility as the HSB. Minnows were
fed Tetramin flake food (Dr. Foster and Smith Aquatics, Inc., Rhinelander, WI, USA).
Both species of fish were used in accordance with Clemson University Institute of
Animal Use and Care Committee (AUP 2012-067 and 2014-015).
HSB Training
Since the HSB were fed pelleted feed until large enough to use in the
experiments, the HSB were trained to eat live fathead minnows with six days of group
training. To begin group training, HSB (length: 21.7 + 1.5 cm, mass: 224 + 50 g) were
randomly chosen from their culture holding tanks and placed in one 450 L tank with flow
through water flow. For each training event, four fathead minnows per HSB were placed
in the group-training tank at once for the HSB to consume the minnows in a group
setting. The group training occurred every three days during a 6 d span, for a total of
three group-training events (Day 0, Day 3 and Day 6 in the 450 L tank). After the third
group training feeding event (Day 6), each HSB was placed into individual 80 L aquaria
(1 HSB/tank) to allow 9 days for them to acclimate to the aquaria before the experiment
began. The HSB had an individual training period with three feeding events, where each
HSB was again fed four live fathead minnows every three days. During these individual
training events, a researcher would drop four fathead minnows at the same time into the
tank containing one HSB. The researcher had a stopwatch that ran continuously and the
time was marked when the minnows were dropped into the HSB tank and when the HSB
ate each one of the four minnows. To delineate between the four different minnows that
are simultaneously dropped into the tank, prey 1 corresponds to the first of the four
minnows the HSB consumed, prey 2 is the second minnow that was consumed, prey 3
was the third minnow consumed, and prey 4 was the fourth minnow the HSB consumed.
The HSB were given a total of 25 min time to eat all four minnows. If the HSB did not
eat all four fathead minnows within 25 min, the minnows were removed from the tank.
Only the HSB that consistently ate all four fathead minnows in a timely manner in the
individual training period were selected for the experiment.
Experimental Design
The hybrid striped bass predatory behavior assay previously used to quantify the
effects of fluoxetine [10], venlafaxine [11], and a mixture of the two antidepressants [21]
was used in the current study. The third individual training event (described above)
corresponded to day 0 of the experiment. After the feeding event on day 0, the
appropriate methanol or bupropion treatment was added to the water in the HSB tank (as
described in bupropion exposure). During the experiment, the HSB were exposed to
bupropion for 6 d in a static system followed by a 6-d recovery system where bupropion
was flushed from the system via continuous water flow. During the static exposure, water
flow was stopped and water quality (pH, temperature, DO) was monitored every three
days, after each feeding event. After the feeding event on day 6, water flows were turned
on and the same water quality parameters were monitored. The flow rates during the
recovery flow through period were set at 0.22 L/min with a hydraulic retention time of
approximately 2.7 h, allowing for approximately nine water exchanges in 24 h.
Throughout the twelve day experiment, HSB were fed four live, unexposed fathead
minnows every three days, with a researcher quantifying the time it took the HSB to eat
each one of the four minnows during each feeding event (Day 0, 3, 6, 9,12). The HSB
were given a total of 25 min (1500 s) to eat all four minnows. If after 25 min the HSB did
not eat all the minnows, the minnows were removed from the system and the HSB was
given a time of 1500 s for any uneaten minnows. After each feeding event (days 0, 3, 6,
9, and 12 of the experiment), five HSB from each treatment were euthanized and their
brains excised for monoamine analysis. The HSB were euthanized by submersion in
MS222 (1.5 g/L MS222 buffered with CaCO3 (pH 7.0-7.5) until operculum movement
ceased, and brains were removed immediately and stored at -80°C until analysis.
Chemicals and Reagents
Bupropion hydrochloride was purchased from Toronto Research Chemicals, Inc.
(Ontario, Canada). HPLC analytical grade acetonitrile, methanol, triethylamine, and
glacial acetic acid were purchased from Fisher Scientific (Pittsburgh, PA, USA) or
Riedel-de Haen (Seelze, Lower Saxony, Germany). Dopamine-d4 (DA-d4),
norepinephrine-d6 (NE-d6), epinephrine-d6 (E-d6) and 5-hydroxytrypamine-d4 (5-HT-
d4) were purchased from C/D/N Isotopes (Pointe-Claire, Quebec, Canada). Water
used for HPLC analysis was purified using a Milli-Q Super-Q Filtration System
(Millipore, Bilerica, MA, USA) to a measured resistance of 18 MΩ. All chemicals and
reagents were purchased from Sigma-Aldrich (St. Louis, MO) unless specified otherwise.
Bupropion Exposure
The HSB tanks were filled with 80L of water and marked with a line to ensure all
exposure volumes were uniform. Every tank was covered with two removable grated
squares and contained air stones to provide constant aeration. All tanks had a standpipe
drilled in the front of the tank to control water volume within each tank during the flow-
through aspect of the experiment. The water used during the experiment was the same as
previously described from Lake Hartwell, SC, USA, with an additional filtration step
from a multi-resin filtration system from Water and Power Technologies (Colombia, SC,
USA). The tanks were randomly assigned to the following four treatment groups:
methanol control (control), 50 ug/L (low), 100 ug/L (medium), and 250 ug/L bupropion
(high). These concentrations were chosen based upon therapeutic relevance, as the
bupropion therapeutic dose of 50-100 ug/L is recommended for humans [20]. While these
concentrations are significantly higher than bupropion concentrations reported in the
aquatic environment, I was interested in elucidating if alteration of the brain
dopaminergic pathway correlated with changes in time to capture prey. Therefore, higher
concentrations that reflect mammalian doses versus environmental relevance were used
to ensure bupropion would alter the brain dopaminergic pathway in the HSB.
Bupropion stock solutions were prepared daily. These solutions were prepared by
dissolving bupropion HCl in methanol. The concentration of the bupropion stock solution
was chosen to ensure <0.1 mg/L methanol was added to each exposure tank (ASTM
E1241-92). Equivalent volumes of the stock solution were added to each tank to achieve
the appropriate nominal treatment concentration. The same methanol concentration in the
highest bupropion treatment was used for the methanol control, to ensure no carrier
solvent effects contributed to the results. After two hours of equilibration in each tank,
water samples were extracted and analyzed with a HPLC and an UV/visible absorbance
detector to confirm exposure concentrations.
Prior to the initiation of the behavioral studies, a bupropion stability study was
performed. A 6-d exposure was performed following the same experimental setup as
described for the behavioral studies with replicates of three bass/treatment. During this 6-
d experiment, water samples were taken daily and analyzed to determine the stability of
bupropion over the 6 d static exposure period. These half-life studies in the system
showed that 78% of the initial bupropion concentration remained after the 6 d static
exposure period in the system (data not shown); therefore, the tanks were only spiked
with bupropion on day 0 dose for the duration of the static exposure.
Bupropion Analysis
Water samples were taken from each exposure tank after feeding events on days
0, 3, 6, and 7. Water samples were concentrated on a Waters Oasis HLB solid phase
extraction cartridge and stored at -20°C until eluted. Samples were eluted with methanol
and 1% acetic acid to achieve an expected elution concentration of 5 mg/L bupropion. A
standard curve of 1-10 mg/L was prepared to quantify the bupropion in the sample.
Aqueous concentrations were quantified with HPLC (Waters 1525 Breeze HPLC pump,
Water 717 Plus auto sampler) using an UV/visible absorbance detector (Waters, Milford,
MA, USA) at 254 nm. The mobile phase consisted of 400 mL HPLC grade acetonitrile,
600 mL Milli Q water, and 4 mL HPLC grade triethylamine, acidified to pH 3 with
glacial acetic acid. The mobile phase was filtered with 0.45 μm nylon filters and degassed
prior to use on the HPLC. The flow rate was 1 mL/min and the sample injection volume
was 40 μL. Retention time was 4.75 min.
Brain monoamine analysis
Fish brain samples were rapidly thawed in iced Milli-Q water, and quickly spiked
with deuterium labeled neurotransmitter surrogates (DA-d4, NE-d6, E-d6, and 5-HT-d4).
The brain tissue samples were thoroughly homogenized in Milli-Q water with a Kontes
Pellet Pestle® Motor over iced Milli-Q water. Each homogenate was then split into two
portions. Extraction buffer (150 mM sodium chloride, 50 mM tris
[hydroxymethyl]aminomethane [Tris], 3% sodium dodecyl sulfate [SDS] and 10%
protease inhibitor cocktail) was added to one portion and stored at – 20 °C. Protein
concentrations of the samples were quantified using the Pierce® bicinchoninic acid
protein assay (BCA) kit (Thermo Fisher Scientific, Rockford, IL). A 10 μL of extracted
protein solution was mixed with 80 μL BCA working reagent, incubated at room
temperature for 3 h. The absorbance at 562 nm was measured using a microplate reader
(Molecular devices SpectraMax M2e, Sunnyvale, CA). A calibration curve was prepared
by a series of different concentrations of bovine serum albumin (BSA). The protein
concentrations in the extracts were estimated from the calibration curve.
The second portion of homogenate was centrifuged at 15,000 rpm for 15 min at 4
°C and the pellet obtained was extracted twice by re-suspension in 0.1% (v/v) formic acid
in water. The extract was collected and spiked with internal standard
(phenylpropanolamine), and mixed with 50 μL of 0.4 M sodium bicarbonate (pH adjusted
to 10 with sodium hydroxide) and 150 μL of 10 mg/mL dansyl chloride (Dan-Cl) in
acetone by gentle vortexing for approximately 30 s, followed by incubation at 60 °C for 5
min. After that, another 150 μL of 10 mg/mL Dan-Cl in acetone was added, and followed
by gentle vortexing for 30 seconds and incubation at room temperature for 1 h. After
drying under a stream of nitrogen, the residue was reconstituted in 50 μL of 5% (v/v)
formic acid in methanol, vortexed for ca. 1 min and centrifuged at 15,000 rpm for 15 min
at 4 °C. The supernatant was collected for LC-MS/MS analysis. Quantification of
neurotransmitters and their metabolites was conducted via external calibration. All
calibration standards were prepared in triplicates and followed the dansylation
derivitization procedure as described above. The dansylation derivatization was used to
enhance mass spectrometric detection and improve chromatographic separation of the
neurotransmitters and their metabolites. Performance of this monoamine analysis was
evaluated [22,23]. Spike recovery of all the neurotransmitters and their metabolites
ranged from 73.9 – 127.7%.
Instrumental Analysis
Qualitative and quantitative determination of neurotransmitters and their
metabolites was carried out on an Agilent 1200 Series high performance liquid
chromatography (HPLC) system (Agilent Technologies Inc., Santa Clara, CA, USA) with
an Applied Biosystems (ABI) 3200 QTrap® triple quadrupole linear ion trap mass
spectrometer (MS/MS) equipped with a Turbo VTM electrospray ionization (ESI) source
and Analyst® software version 1.5.2 (Applied Biosystems, Concord, Ontario, Canada).
The chromatographic separation was performed using an Agilent Zorbax eclipse XDB-
C18 rapid resolution high-throughput (RR HT) column (1.8 μm, 4.6 × 50 mm).
Separation was obtained using gradient elution at a flow rate of 250 μL/min, with solvent
A (water with 2 mM ammonium formate and 0.05% (v/v) formic acid at pH 2.98) and
solvent B (methanol with 2 mM ammonium formate and 0.05% (v/v) formic acid) at the
composition of 95:5 (v/v) at t = 0 min to t = 5 min, changed linearly to 50:50 (v/v) in a
period of 1 min, followed by changing linearly to 5:95 (v/v) in a period of 19 min then
held at such composition for a further 20 min. The dansylated sample extracts were
maintained in the autosampler at 4 °C until injection.
All neurotransmitters and their metabolites were quantified using ESI followed by
scheduled multiple reaction monitoring (sMRM). The ESI source operated in positive ion
mode, and its main working parameters for the TurboIonSpray probe were set as follows:
ion spray voltage (IS): 5500V; gas 2 heater temperature (TEM): 750 °C; nebulizer gas 1
(GS 1): 60 psi (air); auxiliary gas 2 (GS 2): 50 psi (air); curtain gas (CUR): 20 psi
(nitrogen); probe y-axis position: 7 mm; x-axis: 5 mm. Nitrogen (> 99.995% purity) was
used as the collision activated dissociation gas (CAD = high) introduced into the collision
cell. Each analyte was monitored using individually optimized MRM transition. The
compound-dependent parameters (declustering potential [DP], entrance potential [EP],
collision cell entrance potential [CEP], collision energy [CE] and collision cell exit
potential [CXP]) and expected retention time of each MRM transition were summarized
in Table 2.1. The MRM detection window was 150 s and Target Scan Time was 1.5 s.
Statistical Analysis
JMP 11.0 (SAS, Cary, NC, USA) was used to analyze time to capture prey data
by a statistical model using treatment, day, treatment by day interactions, and tank nested
within treatment as a random effect, as the independent variables, sorted by prey number.
A least squared means differences student's t test was run to make multiple pairwise
comparisons of the model output to determine statistical differences between day,
treatment, and treatment by day interactions. Because the experimental design has one
HSB per tank, using tank as a random variable corrected for the repeated measures of the
behavioral component of this study. A one-way ANOVA was performed to analyze the
brain neurotransmitter data with concentration as the independent variable, sorted by day.
A least squared means differences student's t test was then performed to make multiple
comparisons of each concentration against the control level.
Results and Discussion
The average water quality (mean + standard deviation) over the course of the
entire experiment was 21.97 + 1.84° C for temperature, 6.77 + 0.52 for pH, and 8.58 +
1.12 ppm dissolved oxygen. The mean + standard deviation bupropion concentrations
over the six days of the static exposure were 38.28 + 3.22, 78.92 + 17.27, and 217.9 +
28.6 ug/L for the low, medium and high treatments. Solid phase extraction efficiencies
were 95 to 100 % (data not shown). Bupropion was below the detection limit in all
exposure tanks by 24 hours of flow through water flow.
Exposure to bupropion did not alter the time to capture prey compared to controls
over the course of the 12-day experiment (Figure 2.2). There were no statistical
differences in the time it took the HSB to capture the first prey fish (prey 1), second prey
fish (prey 2), or third prey fish consumed (prey 3) compared to controls. Prey 4 data were
not included as the data associated with this prey fish were quite variable.
On day 3 of the experiment, the whole brain concentrations of many dopaminergic
metabolites were increased above control concentrations (Figures 2.3 and 2.4).
Specifically, tyrosine, dopamine (DA), 3,4 dihydroxyphenylacetic acid (DOPAC, a
dopamine metabolite), homovanillic acid (HVA, a DOPAC metabolite), 3-
methoxytryramine (3MT, a dopamine metabolite), and the ratio of DOPAC: DA were all
increased above control concentrations (p=0.05) for the medium treatment of bupropion
(Figure 2.4). Whole brain serotonin concentrations were not altered from control levels
by exposure to bupropion on day 3. It is not surprising that L-3,4-dihydroxyphenylalanine
(L-DOPA) was not significantly elevated by bupropion, as L-DOPA is quickly and
efficiently converted to dopamine [7]. Overall, bupropion altered the brain concentrations
of neurotransmitters in the dopaminergic pathway on day 3 in the HSB. Norepinephrine
brain concentrations appeared to be elevated above control concentrations on day 3;
however, this was not statistically different from the controls (Figure 2.4). The lack of
effects on brain norepinephrine concentrations in the HSB observed in this study are
consistent with the findings of Bisesi et al. [11] when HSB were exposed to venlafaxine,
a drug also targeting norepinephrine, in that study brain norepinephrine concentrations
were also not altered [11]. These results may be due to a difference in binding affinity for
these drugs for the dual receptors they are designed to alter. In the case of bupropion, the
affinity to block uptake of dopamine was determined to be 0.54 μM versus 0.98 μM for
norephinephrine transport (measured as Ki), providing evidence that bupropion has about
2x stronger affinity to block dopamine reuptake than norepinephrine [24]. A difference in
affinity for the serotonin and norepinephrine reuptake transporters have also been
observed in venlafaxine binding [25], which may explain why alteration of
norepinephrine concentrations were not observed in either study. All of the dopaminergic
pathway neurotransmitters that were increased on day 3 returned to control levels by day
6 (Figure 2.5), and remained unchanged from controls for the remainder of the 12 d
experiment. The low bupropion treatment exhibited an increase in serotonin on day 6;
however, I speculate that this is a random response as it was neither dose dependent nor
observed for any of the other neurotransmitters at low bupropion exposure. On day 9,
after three days in a flow-through system with no bupropion, norepinephrine was
increased for the medium bupropion exposure (p=0.0243) (data not shown). By day 12,
the sixth day of a recovery in a flow-through system, all neurotransmitters were similar to
control levels (data not shown).
Bupropion may take up to 6-8 weeks to exert its antidepressant effects in humans
[17], as desensitization of the neurotransmitter autoreceptors is required [26]. Rats
exposed to bupropion by IP injection displayed the greatest increase in brain
norepinephrine and dopamine concentrations 40 minutes after injection, with a
subsequent decrease back to control levels after 120 minutes [27]. A similar observation
was found in mice with the effects of bupropion depleting after 30 minutes of IV
exposure [28]. Therefore, it could be possible that a similar response occurred in the
present study, with the increased dopaminergic neurotransmitter concentrations on day 3
and return to control levels by day 6, most likely due to autoreceptors not being
desensitized within that time frame.
In the present study, we found that the medium bupropion treatment caused a
statistically significant increase in the concentration of tyrosine, dopamine, and many of
dopamine's metabolites on day 3 in a non-dose dependent manner since the highest
bupropion exposure did not cause the greatest increase in these neurotransmitters. The
low and medium treatments correspond to human therapeutic doses. A similar non-dose
dependent increase in brain neurotransmitters was also observed in mammalian studies.
Mice exposed to bupropion at 20 mg/kg caused an increase in brain norepinephrine
concentrations, while 40 mg/kg caused a decrease in brain norepinephrine levels from
controls, showing a non-dose dependent response for norepinephrine [29]. It is possible
that the low and medium bupropion doses in this study had the greatest effect on altering
neurotransmitters in the dopaminergic pathway before negative feedback mechanisms
began, while the high treatment immediately caused a negative feedback mechanism to
shut down the synthesis pathway, thus a dose dependent alteration in the
neurotransmitters was not observed.
Few studies have examined the effects of bupropion on aquatic organisms. Painter
et al. (2009) concluded bupropion exposure to fathead minnows during the larval stage of
development exhibited a decreased velocity and decreased total escape response at 12 d
old [19]. Male fathead minnows exposed to environmentally relevant concentrations of
bupropion displayed a decreased expression of common male fathead minnow sexual
characteristics, measured by tubercles, dorsal pad, and color expression [18]. However, in
these fish studies, neurotransmitter concentrations were not quantified. Thus, I am unable
to compare how these behaviors and effects may correlate with changes in
neurotransmitter concentrations caused by bupropion. Understanding the link between
brain neurotransmitter concentrations and different behaviors will help better identify
potential adverse effects based on specific mechanisms of action of different
pharmaceuticals in the environment. This study provided evidence that alteration of brain
dopaminergic neurotransmitter concentrations does not cause an adverse effect on
predatory behavior in the HSB. Though behavior is a complex collection of biochemical
and environmental responses and it is hard to identify one single neurotransmitter
responsible for any one behavior, some correlations between monoamine concentrations
and behavior have been established. Dopamine has been associated with locomotor
behavior. Locomotor effects were observed after administration of dopamine agonist
drugs, such as apomorphine, and yielded stereotypy, which in general refers to behaviors
consisting of constant, repetitive movements [30]. However, at low doses of dopamine
agonist drugs, a sedative effect on locomotion was observed in mice [30]. Despite the fact
that HSB dopamine concentrations were altered by exposure to bupropion in this study, I
did not examine if predator locomotion was affected. However, even if the predator's
locomotion was affected, it did not alter the predator's ability to capture unexposed prey
in this bioassay. Dopamine has also been associated with aggression in a variety of
species. Throughout the exposure, increased aggression was qualitatively observed for
the HSB exposed to bupropion, with the HSB hitting volumetric flasks when they were
placed in the tank to collect water samples.
Summary and Conclusions
Hence, to further our understanding of the effects of antidepressants on fish brain
chemistry and predatory behavior, the present study demonstrated that HSB exposed to
bupropion, an antidepressant that is marketed as a norepinephrine and dopamine reuptake
inhibitor, altered brain dopaminergic neurotransmitter concentrations in the hybrid striped
bass but did not cause an alteration in time to capture prey in the HSB. These results
suggest that alteration of the dopaminergic pathway does not affect predatory behavior.
The results of the present study, when presented in context with previous studies, suggest
that serotonin may be the controlling neurotransmitter in HSB predatory behavior. To be
more conclusive, it will be necessary to test other antidepressants that target other
neurotransmitters, such as norepinephrine, epinephrine, etc., without altering serotonin
concentrations, to see if they have an effect on predation behavior.
TABLES AND FIGURES
Table 2.1. Scheduled multiple reaction monitoring (sMRM) parameters for
bupropion exposure brain chemistry analysis. The mass spectrometer parameters and
ion transitions are provided that were used to identify and quantify the various
neurotransmitters in the HSB whole brain homogenates.
Rt, DP, EP, CEP CE, CXP
Transition, min V a V b
V c V d
Homovanillic Acid
24.9 47.5 5.0 21.8 35.6 3.6
28.2 65.0 6.3 28.3 57.5 2.5
3,4-Dihydrophenylacetic
28.7 46.5 7.6 27.9 42.5 4.0
28.9 73.3 6.2 28.1 62.1 2.6
28.9 74.3 7.4 28.3 60.2 2.4
3-Methoxytyramine
29.4 53.5 7.4 27.9 58.3 3.5
30.6 70.0 7.3 35.3 86.0 3.0
Dihydroxyphenylalanine
30.8 58.3 7.3 34.5 85.5 4.2
30.8 77.5 8.0 34.7 92.4 2.2
31.5 59.3 9.0 34.9 88.3 2.8
Epinephrine-d6
31.5 64.8 8.0 35.0 91.2 2.0
31.6 65.0 10. 34.0 84.5 3.8
Dopamine-d4
31.6 81.0 9.5 34.1 86.2 4.0
a DP, Declustering Potential b EP, Entrance Potential c CEP, Collision Cell Entrance Potential d CE, Collision Energy e CXP, Collision Cell Exit Potential
Figure 2.1. The molecular structure of bupropion.
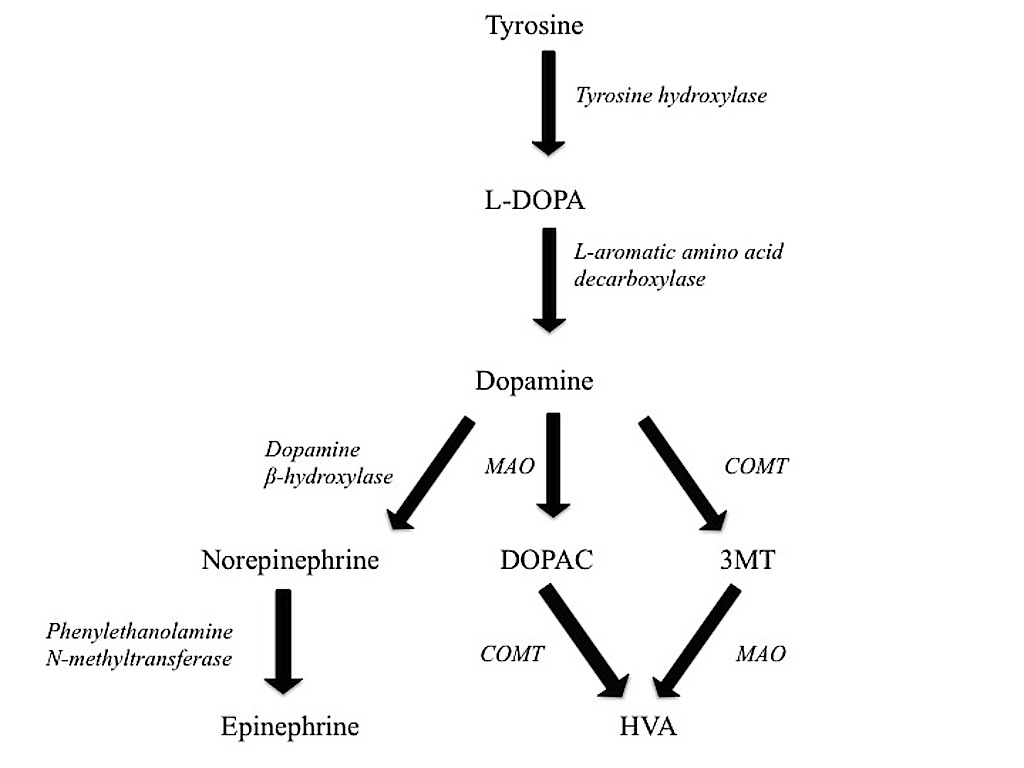
Figure 2.2. The dopaminergic pathway in vertebrate brains.
Tyrosine is converted to L-3,4-dihydroxyphenylalanine (L-DOPA) by tyrosine hydrolase.
L-DOPA is quickly converted to dopamine by L-aromatic amino acid decarboxylase
enzymes. Dopamine is then further broken down to 3,4 dihydroxyphenylacetic acid
(DOPAC) and to a lesser extent 3MT (3-methoxytryramine) by monoamine oxidase
(MAO) and catechol-O-methyl transferase (COMT), respectively, and further broken
down to homovanillic acid (HVA). Norepinephrine is synthesized from dopamine by
dopamine β- hydroxylase and metabolized to epinephrine by phenylethanolamine N-
methyltransferase.
Figure 2.3. The time to capture prey 1, 2, and 3 over the course of the 12-day bupropion experiment.
Each point represents the mean + standard error time to capture prey by the HSB. The time to capture prey was not
significantly altered from controls by exposure to bupropion.
Figure 2.4. Whole brain neurotransmitter concentrations represented as a percent change from control concentrations
on day 3 of the bupropion experiment.
Each neurotransmitter represents the mean + standard error (%) change from controls of 5 bass per treatment on day 3. (*)
indicates statistical significance from control concentrations as determined by the LSMeans Dunnett test at the p=0.05 level.
Tyrosine p=0.0319; Dopamine (DA) p<0.001; 3-methoxytryramine (3MT) p<0.001; 3,4 dihydroxyphenylacetic acid (DOPAC)
p<0.001; Homovanillic acid (HVA) p<0.001; Epinephrine (EP) p<0.001 were all statistically different from controls at the 100
ug/L bupropion dose. L-3,4-dihydroxyphenylalanine (L-DOPA), norepinephrine (NE) and serotonin (5-HT) were not altered
Figure 2.5. Whole brain neurotransmitter concentrations represented as a percent change from control concentrations
on day 6 of the bupropion experiment.
Each neurotransmitter represents the mean + SE (%) change from controls of 5 bass per treatment on day 6. Serotonin (5HT)
(p=0.0272) at 50 ug/L bupropion was statistically significant from control concentrations by the least squared means Dunnett
test. Tyrosine, L-3,4-dihydroxyphenylalanine (L-DOPA), dopamine (DA), 3,4 dihydroxyphenylacetic acid (DOPAC), 3-
methoxytryramine (3MT), homovanillic acid (HVA, norepinephrine (NE) and epinephrine (EP) were not significantly altered
from controls on day 6.
CITATIONS
1. Pratt, L.A., Brody, D.J., & Gu, Q. (2011). Antidepressant use in persons aged 12
and over: United States, 2005–2008. NCHS data brief, no 76. National Center for
Health Statistics, Hyattsville, MD.
2. Kolpin, D.W., Furlong, E.T., Meyer, M.T., Thurman, E.M., Zaugg, S.D., Barber,
L.B., & Buxton, H.B. 2002. Pharmaceuticals, hormones, and other organic
wastewater contaminants in US streams, 1999-2000: A national reconnaissance.
Environmental Science & Technology, 36,1202-1211.
3. Schultz, M.M., Furlong, E.T., Kolpin, D.W., Werner, S.L., Schoenfuss, H.L., &
Barber, L.B. (2010). Antidepressant pharmaceuticals in two US effluent-impacted
streams: Occurrence and fate in water and sediment, and selective uptake in fish
neural tissue. Environmental Science & Technology, 44, 1918-1925.
4. Schultz, M.M., & Furlong, E.T. (2008). Trace analysis of antidepressant
pharmaceuticals and their select degradates in aquatic matrixes by
LC/ESI/MS/MS. Analytical Chemistry, 80, 1756-1762.
5. Brooks, B.W., Chambliss, C.K., Stanley, J.K., Ramirez, A., Banks, K.E., &
Johnson, R.D. (2005). Determination of select antidepressants in fish from an
effluent-dominated stream. Environmental Toxicology and Chemistry, 24, 464-
6. Metcalfe, C.D., Chu, S., Judt, C., Li, H., Oakes, K.D., & Servos, M.R. (2010).
Antidepressants and their metabolites in municipal wastewater, and downstream
exposure in an urban watershed. Environmental Toxicology and Chemistry, 29,
7. Winberg, S., & Nilsson, G.E. (1993). Roles of brain monoamine
neurotransmitters in agonistic behaviour and stress reactions, with particular
reference to fish. Comparative Biochemistry and Physiology Part C:
Pharmacology, Toxicology and Endocrinology, 106, 597-614.
8. Kreke, N., & Dietrich, D.R. (2008). Physiological endpoints for potential SSRI
interactions in fish. CRC Critical Reviews in Toxicology, 38, 215-247.
9. Boyer, E.W., & Shannon, M. (2005). The serotonin syndrome. New England
Journal of Medicine, 352, 1112-1120.
10. Gaworecki, K.M., & Klaine, S.J. (2008). Behavioral and biochemical responses of
hybrid striped bass during and after fluoxetine exposure. Aquatic Toxicology, 88,
11. Bisesi Jr, J.H., Bridges, W., & Klaine, S.J. (2014). Effects of the antidepressant
venlafaxine on fish brain serotonin and predation behavior. Aquatic Toxicology,
12. Perreault, H.A.N., Semsar, K., Godwin, J., 2003. Fluoxetine treatment decreases
territorial aggression in a coral reef fish. Physiol. Behav. 79, 719–724.
13. Khan, I.A., Thomas, P., 1992. Stimulatory effects of serotonin on maturational
gonadotropin release in the Atlantic croaker Micropogonias undulatus.
Gen.Comp. Endocrinol. 88, 388–396.
14. Johnston W. L., Atkinson J. L. and Glanville N. T. (1992) Effect of PCPA or
tryptophan on brain serotonin and on consumption of high protein or high
carbohydrate diet by rainbow trout, Oncohynchus mykiss. J. Nutr. Biochem. 3,
15. Ferriere, F., Khan, N.A., Troutaud, D., Deschaux, P., 1996. Serotonin modulation
of lymphocyte proliferation via 5-HT1A receptors in rainbow trout
(Oncorhynchus mykiss). Dev. Comp. Immunol. 20, 273–283.
16. Munro A. D. (1986b) Effects of melatonin, serotonin, and naloxene on aggression
in isolated cichlid fish (Aequidens pulcher). J. Pineal Res. 3, 2577262.
17. Medictions: Wellbutrin. 2013. National Alliance on Mental Illness. Arlington,
VA. NAMI. [cited 22 December 2014]. Availabile from:
18. Schultz MM, Painter MM, Bartell SE, Logue A, Furlong ET, Werner SL,
Shoenfuss HL 2011. Selective uptake and biological consequences of
environmentally relevant antidepressant pharmaceutical exposures on male
fathead minnows. Aquatic Toxicology 104: 38-47.
19. Painter MM, Buerkley MA, Julius ML, Vajda AM, Norris DO, Barber LB. 2009.
Antidepressants at environmentally relevant concentrations affect predator
avoidance behavior of larval fathead minnows (Pimephales promelas).
Environmental Toxicology and Chemistry 28: 2677-2684.
20. Schulz, M., & Schmoldt, A. (2003). Therapeutic and toxic blood concentrations
of more than 800 drugs and other xenobiotics. Die Pharmazie-an International
Journal of Pharmaceutical Sciences, 58(7), 447-474.
21. Bisesi Jr. JH, Sweet LE, van den Hurk P, & Klaine SJ. (Accepted 2015). Effects
of an antidepressant mixture on the brain chemistry and predatory behavior of
hybrid striped bass. Environmental Toxicology &Chemistry.
22. Cai, H.L., Zhu, R.H., Li, H.D. (2010). Determination of dansylated monamine
and amino acid neurotransmitters and their metabolites in human plasma by liquid
chromatography-electrospray ionization tandem mass spectrometry. Anal.
Biochem., 396, 103-111.
23. Guo K, Li L. 2009. Differential 12C-/13C-isotope dansylation labeling and fast
liquid chromatography/mass spectrometry for absolute and relative quantification
of the metabolome. Anal. Chem. 81:3919-3932.
24. Javitch, J. A., Blaustein, R. O., & Snyder, S. H. (1984). [3H] Imazindol binding
associated with neuronal dopamine and norepinephrine uptake sites. Molecular
Pharmacology, 26(1), 35-44.
25. Owens, M. J., Morgan, W. N., Plott, S. J., & Nemeroff, C. B. (1997).
Neurotransmitter receptor and transporter binding profile of antidepressants and
their metabolites. Journal of Pharmacology and Experimental Therapeutics,
283(3), 1305-1322.
26. Elhwuegi, A.S. (2004). Central monoamines and their role in major depression.
Progress in Neuro-Psychopharmacology and Biological Psychiatry, 28, 435-451.
27. Hasegawa, H., Meeusen, R., Sarre, S., Diltoer, M., Piacentini, M.F., & Michotte,
Y. (2005). Acute dopamine/norepinephrine reuptake inhibition increases brain
and core temperature in rats. Journal of Applied Physiology, 99, 1397-1401.
28. Slemmer, J.E., Martin, B.R., Damaj, M.I. (2000). Bupropion is a nicotinic
antagonist. Journal of Pharmacology and Experimental Therapeutics, 295, 321-
29. Dhir, A., & Kulkarni, S. (2007). Involvement of nitric oxide (NO) signaling
pathway in the antidepressant action of bupropion, a dopamine reuptake inhibitor.
European Journal of Pharmacology, 568, 177-185.
30. Mason, S.T. (1984). Catecholamines and Behaviour. Cambridge University Press,
Cambridge, London, England.
CHAPTER THREE
IDENTIFICATION OF THE SEROTONIN REUPTAKE TRANPSORTER
(SERT) AND BINDING AFFINITY OF ANTIDEPRESSANTS TO
THE SERT IN THE HYBRID STRIPED BASS
Antidepressants are designed to alter brain chemistry in humans. Once in the
brain, selective serotonin reuptake inhibitor (SSRI) antidepressants are designed to bind
to the serotonin reuptake transporter (SERT) preventing the transporter from being able
to remove serotonin from the synapse [1,2]. The binding affinity of an antidepressant for
its respective target is used in mammalian studies to predict drug efficacy and side effects
[3]. Briefly, these studies are performed by incubating a brain homogenate containing the
receptor of interest, in this case the SERT, with a constant amount of radiolabeled
antidepressant in the presence of an increasing amount of competing, unlabeled
antidepressant. The constant amount of radiolabelled antidepressant is added to each
sample to displace the unlabeled antidepressant and to provide a means of quantifying the
binding. The sample matrix is then poured over a filter to retain the bound radiolabelled
antidepressant-SERT complexes, while all unbound will pass through the filter. The filter
is then added to scintillation cocktail and radioactivity is analyzed on a scintillation
The binding affinity of an antidepressant is dependent on the amount of
radiolabelled antidepressant used and the amount of the receptor present in the
homogenate, among other factors. Thus, the antidepressant binding affinity values in the
literature are expressed as the inhibition constant (Ki) [3,5,6]. The Cheng- Prusoff
equation (Equation 1) illustrates how to calculate the binding affinity of an unlabeled
antidepressant, Ki, using Equation 1 [6]:
Ki= IC50/ [1 + ([L]/KD)]
Where Ki is the concentration of an unlabeled antidepressant to occupy 50% of the
serotonin reuptake transporters (SERT), IC50 is the concentration of a competing
antidepressant to displace half of the radioactive ligand, [L] is the concentration of the
radioligand used in the assay, and KD is the concentration of the radioligand that will
occupy 50% of the SERT receptors [4, 6-8]. The use of the Cheng-Prusoff equation to
calculate Ki provides a way to normalize binding affinity values, by taking into account
the amount of radiolabelled ligand used and the amount of receptors, resulting in a value
that can be compared across laboratories [3].
While there is extensive knowledge on the effects of SSRIs on mammalian brains,
there is a very limited amount of research examining antidepressant binding affinity to
the SERT in different fish species. Gould et al. [5] quantified the binding affinity of some
antidepressants and pesticides to the SERT in both the fathead minnow and golden shiner
minnow. The authors found that the Ki (binding affinity) of [3H] citalopram was higher
in both the golden shiner minnow and the fathead minnow than in the rat, suggesting a
lower affinity for SERT [5]. Wang et al. [9] performed [3H] serotonin uptake assays in
the presence of unlabeled fluvoxamine, an SSRI antidepressant, with the zebrafish SERT
transfected in a cell line. Fluvoxamine inhibited serotonin transport in the zebrafish
SERT cell line, providing evidence that the functionality of the zebrafish SERT is similar
to the human SERT [9].
The SERT has been identified in the medaka, stickleback, zebrafish, and goldfish,
and predicted in many more fish species. The SERT has been shown to be highly
conserved in vertebrates; however, this transporter has not been identified in the hybrid
striped bass (Morone saxatilis x. Morone chrysops). Though the SERT may be present in
several fish species, it still remains uncertain whether the receptor binding affinity in the
hybrid striped bass is similar to mammalian receptors. Therefore, this research tested the
hypothesis that SSRIs will have similar SERT binding affinities in hybrid striped bass
brain homogenates in to minnows [5] and lower affinity than in mammals [3]. The
receptor binding affinity in fish is of increasing concern as these compounds are
continually being detected in the aqueous environment, especially in effluent dominated
streams [10-13]. Further, identification of the SERT and quantification of the binding
affinity of these SSRI compounds to the SERT in the hybrid striped bass brain
homogenate will provide a better understanding of the molecular initiating event
produced by these compounds in the aqueous environment.
Materials and Methods:
Chemicals and Reagents
Molecular biology grade of the following chemicals were purchased from Fisher
Scientific (Pittsburg, PA, USA): chloroform, ethanol, isopropanol, potassium chloride,
tris (hydroxymethyl)aminomethane (Tris), tris hydrochloride, polyethylimine, and
sodium chloride. Stat 60 reagent (Tel Test, Inc., Friendswood, TX, USA), RNAsecure
(Ambion/Life Technologies, Grand Island, NY, USA), glass fiber filters (Whatman),
PCR Master mix 2x (Promega, Madison, WI, USA), nuclease free water, venlafaxine
hydrochloride (LKT Laboratories, St. Paul, MN, USA), citalopram hydrobromide (TCI
America, Portland, OR, USA), and sertraline hydrochloride (TCI America, Portland, OR,
USA) were also purchased from Fisher Scientific (Pittsburgh, PA, USA). [3H] Citalopram
(84.5 Ci/mmol) and Ultima Gold Scintillation cocktail were purchased from PerkinElmer
(Shelton, CT, USA). Fluoxetine hydrochloride was generously donated by Fermion
Identification of the SERT
Tissue extraction
Hybrid striped bass were euthanized with MS-222. Brain and stomach samples
were excised immediately and flash frozen in liquid nitrogen initially before being stored
in a -80°C freezer. RNA extractions were performed with approximately 75 mg of a
frozen tissue sample homogenized in Stat-60 RNA extraction reagent (Tel-Test, Inc.).
After 5 min, chloroform was added to the solution and the solution was centrifuged at
14,000 rpm for 15 min at 4°C. The RNA separated into the upper aqueous phase and
DNA and proteins partitioned into the lower, red phenol chloroform phase. The aqueous
phase was transferred to a new tube and a second chloroform extraction was performed,
following the same methods. The aqueous phase was again transferred to a new tube and
isopropanol was added. Samples were left at -20°C overnight. After centrifugation at
14,000 rpm at 4°C for 45 min, the RNA precipitated to form a pellet. The supernatant
was removed and the pellet was washed with 75% ethanol, centrifuged at 7500 rpm for 5
min at 4°C. The ethanol supernatant was removed and the pellet was dried. The pellet
was then suspended in RNAsecure (Life Technologies) and the concentration of nucleic
acid was determined using a NanoDrop (Thermo Scientific, Inc., Wilmington, DE, USA).
The extracted RNA was then treated with DNAse following the PerfeCta DNase 1
Protocol (Quanta Biosciences, Inc., Gaithersburg, MD, USA). Reverse transcription was
performed using a qScript cDNA synthesis kit (Quanta Biosciences, Inc., Gaithersburg,
MD, USA), following the manufacturer's instructions, on both the brain and stomach
Primer Design
Primers for identification of the HSB SERT (also known as slc6a4) were designed
by aligning the mRNA coding sequences of the SERT from striped bass and white bass
(which were generously shared by Dr. Eric Peatman, Auburn University) [14] as well as
human (GenBank accession number NM001045.5), zebrafish (GenBank accession
number DQ285098.1), and predicted tilapia (GenBank accession number
XM005473325.1). Candidate primers were selected from conserved regions within the
aligned sequences and tested in the OligoAnalyzer tool (Integrated DNA Technologies,
Coralville, IA). PCR was conducted with the candidate primer set, PCR 2x master mix
(Promega Corp.), nuclease free water, and the stomach and brain cDNA (separately),
using the following temperature cycling parameters: 95°C for 5 min; 40 cycles of: 95°C
for 30 sec, 53 or 58°C (depending on primer set, see table 3.1 for specifics) for 30 sec. ,
72°C for 1 min; 10 min at 72°C; then held at 4°C. Primer sets that produced a sequenced
SERT amplicon can be found in Table 3.1.
RNA Ligase Mediated Rapid Amplification of cDNA Ends (RLM-RACE) was
used to obtain the full sequence of the SERT from initially identified sequences (Life
Technologies, Grand Island, NY, USA). RLM-RACE amplifies cDNA from full length,
adaptor ligated mRNA, which allows for identification of unknown sequence
information. Primers were designed to accompany the ligated ends of the adaptor ligated
mRNA. The 5' RLM-RACE sample preparation was performed by treating the brain or
stomach HSB RNA with Calf Intestine Alkaline Phosphatase (CIP) to remove free 5'
phosphates on fragmented mRNA and other types of unwanted RNA or DNA in the
sample, resulting in only intact, full length mRNA remaining in the sample. Tobacco
Acid Pyrophosphatase (TAP) then removed the cap structure from this full length mRNA
so that an adaptor sequence could be ligated on to the 5' end (RLM-RACE Manual). PCR
is then performed to amplify the sequence of interest using a RLM-RACE kit provided
primer corresponding to the adaptor sequence and a user designed gene specific primer
for the target gene. 3' RACE is easier to perform because the sample preparation is a lot
less involved. First strand cDNA is made from the CIP treated mRNA and using a 3'
RACE Adapter to the poly (A) end of the CIP treated mRNA. PCR is then performed to
amplify the sequence of interest using a primer provided by the RLM-RACE kit that is
complimentary to the RACE adaptor on the sample cDNA, and the user supplies a primer
specific to the gene of interest (RLM-Race Manual). The gene specific designed primers
for both the standard PCR reactions and RACE reactions are shown in Table 3.1.
Hybrid Striped Bass homogenate binding experiments
Hybrid striped bass (HSB) were euthanized using MS-222 and their brains were
excised. Brains were prepared using methods from D'Amato et al. [15] and Gould et al.
[5]. Immediately following dissection, HSB brains were rinsed in ice cold assay buffer
(50 mM tris, 120 mM NaCl, 5 mM KCl, pH=7.4) and then homogenized in 25 mL of
fresh, ice cold assay buffer. Solutions were centrifuged at 48,000xg for 10 min at 4°C.
Supernatant was discarded and pellets were resuspended in fresh buffer and centrifuged
again. This was repeated twice before the final suspension was adjusted to achieve a 1
mg/mL protein concentration, as measured by Pierce BCA protein assay (Life
Technologies, Inc).
A saturation binding assay was first performed to ensure saturation of the receptor
occurred within the homogenate and to provide the maximal number of binding sites
(Bmax) and the dissociation constant for the radioligand (KD) at the SERT. To perform the
saturation binding assay, [3H] citalopram (a tritium labeled SSRI) was chosen to quantify
binding to the SERT based on similar studies [3,5,15]. Each glass test tube contained 100
μL of fresh brain homogenate (1 mg/mL protein concentration, determined by Pierce
BCA Protein assay) for a final assay volume of 250 μL. The saturation binding
experiments were performed by quantifying total binding (SERT receptor + increasing
[3H] citalopram concentrations) and nonspecific binding (SERT receptor + increasing
[3H] citalopram concentrations + unlabeled 10 μM sertraline) in triplicate, with [3H]
citalopram concentrations ranging from 0.15 nM to 200 nM. Nonspecific binding was
measured by addition of sertraline, in excess, to the brain homogenate to saturate the
SERT receptors in the homogenate following methods by Gould et al. [5], D'Amato [15],
and Owens et al. [3], which provided a way to quantify how much [3H] citalopram was
nonspecifically bound to other items in the homogenate. Blank samples were prepared
following these same methods with the exception that [3H] citalopram was not added.
The assay was run for one hour at room temperature. The assays were terminated with
addition of 4 mL ice cold buffer into the test tube. The solutions were poured over
Whatman GF/B glass fiber filters (presoaked in 0.5% polyethylimine for 10 minutes to
reduce nonspecific binding). The filters were rinsed three times with 5 mL buffer and
dried to completeness under vacuum. The dried filters were placed in 20 mL scintillation
vials with 10 mL Ultima Gold scintillation cocktail and quantified using a Beckman 6500
scintillation counter.
Competitive radioligand binding assays were performed in triplicate to determine
the binding affinity of the following SSRI antidepressants: fluoxetine, venlafaxine,
sertraline, and citalopram. A constant concentration of 5 nM [3H] citalopram, determined
from the saturation binding experiment, was added in the presence of 11 concentrations
of the unlabeled antidepressant ranging from 0 to 160 nM. Total binding (SERT receptor
+ [3H] citalopram + increasing unlabeled competing antidepressant concentration (0-160
nM)) and nonspecific binding (receptor + [3H] citalopram + increasing concentrations of
unlabeled competiting antidepressant + 10μM sertraline) were determined in triplicate for
each antidepressant's competitive radioligand binding experiment. Nonspecific binding
and blanks were measured as described in the saturation binding experiments. The assay
was run for one hour at room temperature, which previously determined to be long
enough to reach equilibrium (data not shown). The assays were terminated with addition
of 4 mL ice cold buffer into the test tube. The solutions were poured over Whatman GF/B
glass fiber filters (presoaked in 0.5% polyethylimine for 10 minutes to reduce nonspecific
binding). The filters were rinsed three times with 5 mL buffer and dried to completeness
under vacuum. The dried filters were placed in 20 mL scintillation vials with 10 mL
Ultima Gold scintillation cocktail and quantified using a Beckman 6500 scintillation
Statistical Analysis
GraphPad PRISM 6.0 was used to quantify the KD, Bmax, and Ki values using the receptor
saturation binding and receptor competitive binding nonlinear models built in to the
statistical software.
Results and Discussion
SERT Sequencing
Utilizing the PCR primers designed by aligning the striped bass sequence with the
zebrafish, I was able to obtain roughly 60% of the SERT in the hybrid striped bass,
assuming it is of a similar length as the striped bass sequence obtained from the BLAST
transcriptome results. Interestingly, the bands associated with the stomach samples in the
gels were qualitatively brighter than the brain samples, suggesting higher SERT density
in the stomach samples. The cDNA sequence obtained from PCR amplification was very
similar to the striped bass sequence (Figure 3.1); however, parts of the sequence were
missing at both the 5' and 3' ends. Thus, RLM-RACE was used to identify these missing
portions. 3' RLM-RACE was performed according to the manufacturer's directions and
samples were run on gel electrophoresis. The gels were imaged and bands were excised
and purified using a QIAGEN QIAquick gel extraction kit (QIAGEN, Valencia, CA,
USA), following the manufacturer's instructions. These samples were submitted for
sequencing and approximately 80% of the sequence was identified. 5' RLM-RACE did
not yield any results; so, a portion of the sequence at the 5' end remains unknown (Figure
Though I was not able to identify the entire SERT sequence in the hybrid striped
bass, I have sequenced roughly 80%, compared to the striped bass sequence. Using the
sequence I have identified in the hybrid striped bass, I compared this sequence to the
SERT sequences reported in other vertebrate species (Table 3.2). The hybrid striped bass
sequence had a very high similarity to other teleost species, and had roughly a 72%
identity to the human SERT. The functional domain of the SERT protein in humans has
been identified in a variety of studies [16-24]. Menningen et al. [25] compiled the
functional domains identified in each study in their review of the slc6a4 in fish. Utilizing
the identified amino acid residues involved in SSRI binding [16-25], we were able to
compare the functional domain identified in other vertebrates [16-25] with amino acid
residues in the hybrid striped bass. The majority of these amino acid residues were
present in the hybrid striped bass translated sequence, suggesting that the functional
domain of the SERT is highly conserved within the hybrid striped bass (Figure 3.3).
Brain Homogenate Binding Results
Saturation of the brain homogenate was achieved in the saturation binding
experiment. This study revealed the maximum density of receptors, Bmax, in the
homogenate to be 106.5 fmol/mg protein and KD= 12.6 nM (Figure 3.4). Nonspecific
binding was less than 20% of total binding.
The competitive radioligand binding assay identified the binding affinity of
citalopram, sertraline, fluoxetine, and venlafaxine to the SERT in the hybrid striped bass
brain homogenate (Table 3.3). The antidepressants ranked by Ki values were sertraline <
fluoxetine < citalopram < venlafaxine (Table 3.3). Since sertraline had the lowest Ki
value, this suggests it had the strongest affinity for the SERT in the bass homogenate,
with venlafaxine having the lowest affinity for the transporter.
In addition to the SERT being highly conserved in vertebrate species, the
homogenate binding affinity studies confirm that antidepressants are binding to the SERT
in hybrid striped bass brains. The results from this study confirm that [3H] citalopram
reached binding saturation to the hybrid striped bass SERT in the brain homogenate and
was also displaced by competing antidepressants in the competitive binding assay. The
Bmax determined in the saturation study was 106.5 fmol/mg protein, lower than observed
for the golden shiner minnow (Bmax=240 + 46 fmol/mg protein) [5]. The Ki value of
fluoxetine in the hybrid striped bass brain homogenate (Ki= 4 ± 2) was lower than
determined in the golden shiner minnow (Ki= 18+ 6) and fathead minnow (Ki= 11+ 5)
[5]. The Ki for citalopram was the same value for the hybrid striped bass brain
homogenate and the golden shiner minnow brain homogenate. The Ki value for sertraline
(Ki=1 + 2) was also lower in the hybrid striped bass than in the golden shiner minnow
(Ki= 39 + 7) and the fathead minnow (Ki= 65 + 27) [5]. Though the functional domains
were shown to be highly conserved in vertebrate species, it is still possible that slight
differences in the proteins may exist in each species and may account for differing
binding affinities. Due to the nature of homogenate binding experiments, it is also
possible that binding was occurring to other proteins in the complex matrix. The lower
Bmax observed in the bass brain homogenate, though at a similar protein concentration,
may be due to higher nonspecific binding in the hybrid striped bass experiments, yielding
a lower specific binding. The less serotonin reuptake receptors present in the bass brain
homogenate versus the minnow homogenate (determined by lower Bmax) may account for
more competition of binding sites on the receptors; however, antidepressant binding
affinity similarities were observed in between the minnow brain homogenate and the
HSB brain homogenate. In general, the antidepressants' binding affinity to the HSB
SERT was weaker than reported binding affinity values to the human SERT [26] and rat
cortex homogenates [3].
The functional nature of the SERT in the hybrid striped bass was not examined in
this study. However, the functionality of the receptor has been investigated utilizing the
zebrafish slc6a4a receptor [9]. A HEK293 cell line transfected with the zebrafish SERT
found that the zebrafish transporter had similar functionality as the human SERT.
Serotonin transport was also shown to be sensitive to fluvoxamine, a SSRI antidepressant
[9]. Previous studies have shown that hybrid striped bass exposed to fluoxetine and
venlafaxine altered brain serotonin levels in the bass [27, 28]. These results suggest that
these antidepressants are binding to the SERT and the functionality of the transporter is
similar to the human transporter. I hypothesize that the decrease of brain serotonin
(versus the expected increase based on the mode of action of SSRI antidepressants) is due
to the length of exposure in these studies and that in 6 days the serotonin auto receptors
have not become desensitized by the antidepressant exposure. It has been shown that
exposure to the SSRI sertraline decreases the Bmax of the SERT in fish brain
homogenates, suggesting the SERT may be down regulated with long term exposure [29].
However, long term exposure to the serotonin and norepinephrine reuptake inhibitor
venlafaxine in rats did not alter serotonin or norepinephrine binding in rat brains [30].
Therefore, investigation of the Bmax after fluoxetine and venlafaxine exposures may
provide insight into how the receptor density changes in the hybrid striped bass in
response to these two antidepressants. Further, future studies should utilize the HSB
SERT sequence identified in this work to produce a transfected cell line. With this cell
line, the binding affinity of antidepressants may be quantified in a cleaner matrix and the
functionality of the HSB SERT can be quantified.
Conclusions
The results provide evidence at the molecular level that the target of
antidepressants, the SERT, is present in the hybrid striped bass. Further, I have shown
that antidepressants bind to the SERT in the hybrid striped bass brain homogenate.
Though the binding affinity of antidepressants to the hybrid striped bass SERT were not
as strong as has been reported for the human and rat SERT, this study provides evidence
that antidepressants entering the environment bind to the SERT in nontarget species.
TABLES AND FIGURES
Table 3.1. Designed primers for standard PCR reactions and RLM-RACE reactions. Primers were designed by aligning
the striped bass sequence, tilapia, and zebrafish slc6a4a sequences.
PCR Annealing
Reaction
Forward primer
Reverse primer
Amplicon
Temperature
5' TGG AAA CAC ATC TGC
5' AGA CTG GGA CCA GCA
5' CTA CTA CAA CAC CAT
5' CTG CAA ACG TGC TGT
PCR Annealing
reaction
Outer primer
Inner primer
Amplicon
Temperature
5' AGC CAT AGC AAA CAT
5' CAT TAT GTT GGG TCT
GGA CAG CAC G 3'
Table 3.2. Comparison of slc6a4 sequences to the HSB. Translated protein slc6a4
sequences of various species were aligned and average percent identities to the hybrid
striped bass (HSB) sequence are reported.
Vertebrate Species
Conserved AA compared to HSB
(% Identity)
Table 3.3. The antidepressant binding affinity (Ki) to the HSB brain homogenate.
The mean Ki + standard deviation of each antidepressant to the SERT in a hybrid striped
bass brain homogenate as determined by the competitive radioligand binding experiments
in the presence of 5 nM [3H] citalopram.
Hybrid striped bass
Figure 3.1. Alignment of the HSB SERT sequence to the striped bass SERT
sequence. The striped bass sequence aligned with the HSB sequencing results using PCR
amplification. The gray letters represent the same base pair in both sequences.
Sequencing the PCR amplification results provided about 60% of the hybrid striped bass
Figure 3.2. 3' RACE HSB sequencing results aligned with the striped bass SERT
sequence. The compiled hybrid striped bass sequence from the 3' RACE results are
aligned with the striped bass sequence. Gray letters represent the same base pair in both
sequences. Roughly 430 bp at the 5' end of the sequence remains unknown in the hybrid
striped bass.
Figure 3.3. The functional domains of several vertebrate species' slc6a4 proteins
aligned. The highlighted regions represent areas shown to be involved in SSRI binding in
the human SERT. The majority of these amino acid residues appear to be highly
conserved within the hybrid striped bass.
Saturation Binding of [3H] Citalopram to hybrid striped bass brain
Nonspecific binding
Concentration [3H] citalopram (nM)
Figure 3.4. Saturation binding curve of [3H] citalopram to the SERT in the HSB brain homogenate.
The Bmax was determined to be 106.5 and the KD= 12.6 nM. Error bars represent standard deviation of three replicates.
CITATIONS
1. Kreke, N., & Dietrich, D. R. (2008). Physiological endpoints for potential SSRI
interactions in fish. CRC Critical Reviews in Toxicology, 38(3), 215-247.
2. Boyer, E. W., & Shannon, M. (2005). The serotonin syndrome. New England
Journal of Medicine, 352(11), 1112-1120.
3. Owens, M. J., Morgan, W. N., Plott, S. J., & Nemeroff, C. B. (1997).
Neurotransmitter receptor and transporter binding profile of antidepressants and
their metabolites. The Journal of Pharmacology and Experimental Therapeutics,
283(3), 1305-1322.
4. Davenport, A. P., & Russell, F. D. (1996). Radioligand binding assays: theory and
practice. In Current Directions in Radiopharmaceutical Research and
Development (pp. 169-179). Springer Netherlands.
5. Gould, G. G., Brooks, B. W., & Frazer, A. (2007). [3H] citalopram binding to
serotonin transporter sites in minnow brains. Basic & Clinical Pharmacology &
Toxicology, 101(3), 203-210.
6. Cheng, Y.C., & W.H Prusoff. 1973. Relationship between the inhibition constant
(Ki) and the concentration of inhibitor which causes 50 percent inhibition (I50) of
an enzymatic reaction. Biochemical Pharmacology, 22: 3099–3108.
7. Leysen, J. E., Langlois, X., Heylen, L., & Lammertsma, A. A. (2010). Receptors:
Binding assays. Encyclopedia of psychopharmacology (pp. 1127-1134) Springer.
8. Sittampalam, G. S., Gal-Edd, N., Arkin, M., Auld, D., Austin, C., Bejcek, B.,
Glicksman, M., Inglese, J., Lemmon, V., Li, Z., McGee, J., McManus, O., Minor,
L., Napper, A., Riss, T., Trask, O.J., and Weidner, J. (2012). Calculations and
instrumentation used for radioligand binding assays.
9. Wang, Y., Takai, R., Yoshioka, H., & Shirabe, K. (2006). Characterization and
expression of serotonin transporter genes in zebrafish. Tohoku Journal of
Experimental Medicine, 208(3), 267-274.
10. Kolpin, D. W., Furlong, E. T., Meyer, M. T., Thurman, E. M., Zaugg, S. D.,
Barber, L. B., & Buxton, H. T. (2002). Pharmaceuticals, hormones, and other
organic wastewater contaminants in US streams, 1999-2000: A national
reconnaissance. Environmental Science & Technology, 36(6), 1202-1211.
11. Schultz, M.M., Furlong, E.T., Kolpin, D.W., Werner, S.L., Schoenfuss, H.L., &
Barber, L.B. (2010). Antidepressant pharmaceuticals in two US effluent-impacted
streams: Occurrence and fate in water and sediment, and selective uptake in fish
neural tissue. Environmental Science & Technology, 44, 1918-1925.
12. Lajeunesse, A., Gagnon, C., Gagné, F., Louis, S., Čejka, P., & Sauvé, S. (2011).
Distribution of antidepressants and their metabolites in brook trout exposed to
municipal wastewaters before and after ozone treatment–Evidence of biological
effects. Chemosphere, 83(4), 564-571.
13. Brooks, B. W., Chambliss, C. K., Stanley, J. K., Ramirez, A., Banks, K. E.,
Johnson, R. D., & Lewis, R. J. (2005). Determination of select antidepressants in
fish from an effluent‐dominated stream. Environmental Toxicology and
Chemistry, 24(2), 464-469.
14. Li, C., Beck, B. H., Fuller, S. A., & Peatman, E. (2014). Transcriptome annotation
and marker discovery in white bass (Morone chrysops) and striped bass (Morone
saxatilis). Animal Genetics, 45(6), 885-887.
15. D'Amato, R. J., Largent, B. L., Snowman, A. M., & Snyder, S. H. (1987).
Selective labeling of serotonin uptake sites in rat brain by [3H]citalopram
contrasted to labeling of multiple sites by [3H]imipramine. The Journal of
Pharmacology and Experimental Therapeutics, 242(1), 364-371.
16. Mortensen, O. V., Kristensen, A. S., & Wiborg, O. (2001). Species‐scanning
mutagenesis of the serotonin transporter reveals residues essential in selective,
high‐affinity recognition of antidepressants. Journal of Neurochemistry, 79(2),
17. Larsen, M. B., Elfving, B., and Wiborg, O. 2004. The chicken serotonin
transporter discriminates between serotonin-selective reuptake inhibitors. A
species-scanning mutagenesis study. Journal of Biological Chemistry. 279:
18. Henry, L. K., Field, J. R., Adkins, E. M., Parnas, M. L., Vaughan, R. A., Zou, M.
F., Newman, A. H., and Blakely, R. D. 2006. Tyr-95 and Ile-172 in
transmembrane segments 1 and 3 of human serotonin transporters interact to
establish high affinity recognition of antidepressants. J. Biol. Chem. 281: 2012–
19. Ravna, A. W., Sylte, I., and Dahl, S. G. 2003. Molecular mechanism of
citalopram and cocaine interactions with neurotransmitter transporters. J.
Pharmacol. Exp. Ther. 307: 34–41.
20. Andersen, J., Olsen, L., Hansen, K. B., Taboureau, O., Jørgensen, F. S.,
Jørgensen, A. M., Bang-Andersen, B., Egebjerg, J., Strømgaard, K., Kristensen,
A. S. 2010. Mutational mapping and modeling of the binding site for (S)-
citalopram in the human serotonin transporter. J. Biol. Chem. 285: 2051–63.
21. Plenge, P., and Wiborg, O. 2005. High- and low-affinity binding of S-citalopram
to the human serotonin transporter mutated at 20 putatively important amino acid
positions. Neurosci. Lett. 383: 203–8.
22. Zhou, Z., Zhen, J., Karpowich, N. K., Law, C. J., Reith, M. E., and Wang, D. N.
2009. Antidepressant specificity of serotonin trans- porter suggested by three
LeuT-SSRI structures. Nat. Struct. Mol. Biol. 16: 652–57.
23. Chen, F., Larsen, M. B., Neubauer, H. A., Sánchez, C., Plenge, P., and Wiborg,
O. 2005. Characterization of an allosteric citalopram-binding site at the serotonin
transporter. J. Neurochem. 92: 21–28.
24. Surratt, C. K., Ukairo, O. T., and Ramanujapuram, S. 2005. Recognition of
psychostimulants, antidepressants, and other inhibitors of synaptic
neurotransmitter uptake by the plasma membrane mono- amine transporters. Am.
Assoc. Pharmaceut. Scient. J. 7: E739–51.
25. Mennigen, J. A., Stroud, P., Zamora, J. M., Moon, T. W., & Trudeau, V. L.
(2011). Pharmaceuticals as neuroendocrine disruptors: Lessons learned from fish
on Prozac. Journal of Toxicology and Environmental Health, Part B, 14(5-7),
26. Owens, M. J., Knight, D. L., & Nemeroff, C. B. (2001). Second-generation
SSRIs: Human monoamine transporter binding profile of escitalopram and R-
fluoxetine. Biological Psychiatry, 50(5), 345-350.
27. Gaworecki, K. M., & Klaine, S. J. (2008). Behavioral and biochemical responses
of hybrid striped bass during and after fluoxetine exposure. Aquatic Toxicology,
88(4), 207-213.
28. Bisesi Jr, J. H., Bridges, W., & Klaine, S. J. (2014). Effects of the antidepressant
venlafaxine on fish brain serotonin and predation behavior. Aquatic Toxicology,
148, 130-138.
29. Valenti Jr, T. W., Gould, G. G., Berninger, J. P., Connors, K. A., Keele, N. B.,
Prosser, K. N., & Brooks, B. W. (2012). Human therapeutic plasma levels of the
selective serotonin reuptake inhibitor (SSRI) sertraline decrease serotonin
reuptake transporter binding and shelter-seeking behavior in adult male fathead
minnows. Environmental Science & Technology, 46(4), 2427-2435.
30. Gould, G. G., Altamirano, A. V., Javors, M. A., & Frazer, A. (2006). A
comparison of the chronic treatment effects of venlafaxine and other
antidepressants on serotonin and norepinephrine transporters. Biological
Psychiatry, 59(5), 408-414.
CHAPTER FOUR
BIOAVAILABILITY OF FLUOXETINE AND VENLAFAXINE AS
PREDICTORS OF CHANGES IN BRAIN CHEMISTRY AND PREDATORY
BEHAVIOR IN THE HYBRID STRIPED BASS
Pharmaceuticals have been detected in effluent dominated streams across the
United States primarily due to incomplete removal during wastewater treatment plant
processes. Aquatic organisms take up pharmaceuticals from the water column primarily
via the gills, diet, or maternal transfer in eggs [1]. Of the many different types of
pharmaceuticals, antidepressants are among the most commonly prescribed to humans
[2], and thus are commonly detected in streams at concentrations from the low ng/L to 2
μg/L individually [3-6].
Selective serotonin reuptake inhibitor (SSRI) antidepressants are designed to alter
brain chemistry in humans by binding to the serotonin reuptake transporter, thus
preventing the transporter from removing serotonin from the synapse [7]. Over time, this
mechanism increases neurotransmission and has been effective in improving depression
symptoms in humans. The most commonly studied antidepressants are the SSRIs such as
fluoxetine, sertraline, and citalopram. Another class, the serotonin and norepinephrine
reuptake inhibitors (SNRIs), such as venlafaxine, is less studied but just as prevalent in
the aquatic environment [6]. Despite the low aqueous concentrations in the environment,
antidepressants have been detected in fish plasma samples and in brain, muscle, and liver
tissues [3-6,8,9]. While many studies have detected antidepressants in a variety of tissues,
less work has been done on characterizing bioconcentration factors in the environment
[10] or correlating internal antidepressant doses with observed adverse effects.
Most antidepressants are organic bases with pka values >9 [11]. Thus, these
compounds are ionizable compounds at environmentally relevant pH values between 6
and 9 [5]. The ionization state of a compound can alter bioavailability and toxicity.
During a 48-hour exposure to P. promelas, sertraline toxicity varied nine fold between
pH=6.5 and pH=8.5 [12]. In general, the nonionized compound is more bioavailable to
an organism because it can diffuse across cell membranes more readily than an ionized
compound. In the case of antidepressants, the nonionized form of the drug is more likely
to concentrate in a lipid rich tissue such as the brain, the target of these drugs. Therefore,
the pH of a stream may influence the amount of the antidepressant reaching the brain,
thus influencing changes in brain chemistry and behavior. Valenti et al. [13] developed a
model utilizing the log D (a pH dependent octanol water partitioning coefficient) of an
ionizable compound to predict the fish plasma concentration. This model was altered
from a previously developed model by Huggett et al. [14], and was found to be a very
strong predictor of the antidepressant sertraline partitioning into fish plasma from an
aqueous exposure. The log D plasma model by Valenti et al. [13] has only been tested on
the SSRI sertraline; thus, validating it with other antidepressants would make it more
robust and useful in ecological risk assessment.
Previous research in our lab has quantified effects of fluoxetine and venlafaxine
on brain chemistry and predatory behavior in the hybrid striped bass (HSB) (Morone
saxatilis x. M. chrysops) [15-17]. However, in these studies, antidepressant partitioning
from the aqueous environment into blood circulation and the brain was not quantified,
which is essential to understand the bioavailability of these antidepressants to the HSB
and correlating this bioavailability with adverse behavioral effects and changes in brain
chemistry. Therefore, the objectives of this study were to (1) quantify the plasma and
brain antidepressant concentrations of fluoxetine and venlafaxine (Figure 4.1) in the HSB
over a 3 d exposure, (2) correlate bioavailability of the antidepressants with predatory
behavior and brain chemistry and (3) test the plasma concentrations of fluoxetine and
venlafaxine with the log D plasma model developed by Valenti et al. [13].
Materials and Methods
Fish Culturing
HSB were generously donated by Southland Fisheries (Colombia, SC, USA) as
fingerlings and were grown in flow through, 450 L recirculating tanks. Water was
pumped from a nearby lake, Lake Hartwell, Clemson, SC, USA, into a head pond (pH
6.28 + 0.17, hardness 24 mg/L as CaCO3, alkalinity 10 mg/L as CaCO3). Water then was
filtered through gravel and sterilized using UV sterilization. An in-line chiller/heater
maintained water temperatures between 20 and 25°C throughout the year. HSB were fed
a high protein, sinking, pelleted feed (Silver Cup Fish Feed, Nelson & Sons, Inc., Tooele,
UT, USA). Once the bass grew to the appropriate size for the experiments(length: 22 +
2.6 cm, mass: 143 + 27 g), the bass were trained to eat fathead minnows. Fathead
minnows (P. promelas) were purchased from I.F. Anderson Farms, Inc. (Lonoke,
Arkansas, USA). The fathead minnows were cultured in 100L troughs in the same facility
as the HSB. Fathead minnows were feed a tetramin flake food (Dr. Foster and Smith
Aquatics, Inc., Rhinelander, Wisconsin, USA). The HSB and fathead minnows were used
in agreement with Clemson University Institute of Animal Use and Care Committee
(AUP 2012-067 and 2014-015).
HSB Training
The HSB intended for the experiment were trained to eat live fathead minnows prior to
the start of the experiments. To train the HSB, those of appropriate size were transferred
into a group holding tank (300 L) with flow through water flow and withheld feed for 3
days. In this tank, the HSB went through a group training period. They were fed four
fathead minnows per HSB in the tank every three days, for a total of three feeding events.
After the third group training, each bass was transferred to an individual aquarium (80L)
with flow through water flow for individual training. After three days of acclimation, a
researcher fed each bass four fathead minnows and timed how long it took the bass to eat
each minnow. During each of these feeding events, a researcher would drop in four
fathead minnows simultaneously. A stopwatch was run continuously and the start time
(time the minnows were dropped into the tank) and each time the HSB captured a
minnow was recorded. Three individual training sessions occurred. Bass that consistently
ate all four fathead minnows were selected for the experiment and the third individual
training event corresponded with Day 0 of the exposure period.
Experimental Design
Exposure scenario and experimental design mimicked those used by Gaworecki
and Klaine [15] and Bisesi et al. [16], with only length of exposure and sample size
alterations (n=3 HSB/treatment/time point in this study). After the third individual
training session, the HSB selected for the experiment were randomly assigned to the
following nominal treatments: 0, 35, 75, 150 μg/L fluoxetine or 0, 50, 250, 500 μg/L
venlafaxine. Bass were then randomly assigned to a fluoxetine exposure duration: 6
hours, 24 hours, 48 hours and 72 hours or a venlafaxine exposure duration: 6 hours or 72
hours. The venlafaxine sampling period was shorter than the one for fluoxetine due to
using the data for the development of a model that only needed day 0 and day 3 plasma
readings, while fluoxetine will be used in future studies and having an understanding of
reaching plasma partitioning equilibrium was justified.
During the course of the exposure, bass were fed four fathead minnows on Day 0
and Day 3 (prior to 72 hour time point). The timing of these feeding events was
performed the same way as in the individual training period (see above in HSB Training).
In order to analyze the behavioral data, time to capture prey was broken down for each
prey fish. Time to capture prey 1 corresponds to the average time it took the HSB to
capture the first of the four minnows and time to capture prey 2 corresponded to the
average time it took the HSB to capture the second of the four minnows.
At the end of each exposure, three bass per treatment per time point were
removed and euthanized with MS-222 (1.5 g/L MS222 buffered with CaCO3 (pH 7.0-
7.5)). Plasma from each bass was extracted from the caudal vein and stored on ice, then
centrifuged at 1000g for 10 min at 4°C, transferred to a microcentrifuge tube and stored
at -20°C until analysis. Brains were removed and placed on dry ice, and stored at -80°C
until analysis. Water quality (pH, DO, temperature) was measured every 24 hours during
the 72 hour exposure.
Experiment Chemicals
Fluoxetine hydrochloride was generously donated by Fermion (Finland).
Venlafaxine hydrochloride (LKT Laboratories, Inc., St. Paul, Minnesota, USA), acetone,
HPLC grade methanol, Optima® LC-MS methanol, Optima® LC-MS formic acid, glacial
acetic acid, trace metals grade hydrochloric acid, and triethylamine were purchased from
Fisher Scientific. Fluoxetine –d5 hydrochloride was purchased from CDN Isotopes
(Quebec, Canada). MS-222 was purchased from Pentair Aquatic Habitats (Apopka, FL,
USA). Serotonin creatinine sulfate complex, 5-hydroxyindoleacetic acid (5-HIAA), and
Fluka LC-MS Chromasolv® water were purchased from Sigma Aldrich (St. Louis,
Missouri, USA). Water used for analytical procedures (excluding the LC-MS/MS) was
purified by a Milli-Q Super-Q Filtration (Millipore™, Billerica, MA, USA) system with
a resistivity of 18 MΩ.
Fluoxetine and Venlafaxine Exposures
Stock solutions of fluoxetine and venlafaxine were prepared by dissolving
fluoxetine HCl or venlafaxine HCl in methanol. The stock solution concentrations were
determined to ensure <0.1 mg/L methanol in the exposure tanks (ASTM E1241-92).
Equivalent volumes of methanol was added to the controls as was added to the highest
treatment for each antidepressant. After two hrs equilibration, water samples were taken
from each tank to confirm nominal concentrations. The half life of fluoxetine is known to
be 3 d in our test system [15]; therefore, fluoxetine was only added to the system on day
0. The half life of venlafaxine is known to be 6 d [15], and thus was also only added to
the tanks on day 0. Water samples from each exposure tank were collected every 24
hours during the 72 exposure.
Water Analysis
Depending on the exposure concentration, 100-500 mL of water was collected
from the exposure tank, acidified to pH= 4 with 2 N HCl, and concentrated on a C18
HyperSep solid phase extraction (SPE) cartridge (6 mL, 500 g bed weight). The C18 SPE
cartridge was prepared with 1 volume acetone, 1 volume methanol, followed by 2
volumes of Milli Q water. The water sample was then loaded and dried for 30 minutes.
Cartridges were stored at -20°C until analysis. Fluoxetine and venlafaxine were both
eluted off the SPE cartridges with 99% methanol, 1% acetic acid for a final elution
concentration of 5 mg/L of each antidepressant (standard curves for each antidepressant
ranged from 1 mg/L – 10 mg/L). Samples were analyzed using HPLC (Waters 1525
Breeze HPLC pump, Water 717 Plus auto sampler) with fluorescence detection at
excitation wavelength 270 nm and emission wavelength 300 nm. The mobile phase
consisted of 40:60 acetonitrile: water, with 0.4% triethylamine and the solution was
adjusted to pH 4 with glacial acetic acid. The sample injection volume was 40 μL and the
run time for venlafaxine was 6 minutes and fluoxetine was 12 minutes.
Plasma Analysis
Plasma fluoxetine samples were analyzed using an ELISA kit purchased from
Immunalysis (Pomona, CA, USA), following the manufacturer's directions. Samples
were diluted 1:10 with PBS (pH=7.4) and 50 μL of each diluted sample was added to
each well. Each sample was measured in duplicate. ELISA readings were verified by LC-
MS/MS analysis. Venlafaxine plasma samples were only analyzed on the LCMS-8030
(Shimadzu Corporation, Kyoto, Japan) with tandem quadrupole since ELISA kits were
not available for this compound.
Plasma samples analyzed on the LC-MS/MS were diluted 1:10 with acetonitrile
and 500 ng/L fluoxetine d-5 HCl was added to samples. The samples were then vortexed
and frozen at -80°C until samples were frozen. The samples were then centrifuged for 5
min at 14000 RPM at 4°C. The supernatant was transferred to a new vial and again
frozen and centrifuged again to remove residual protein matrix interferences. LC-MS/MS
plasma analysis measured only fluoxetine, fluoxetine d-5, and venlafaxine in the plasma
samples, using the MRM optimization parameters listed in Table 4.1. An AccucoreTM
RP-MS column (Thermo Fisher Scientific Inc) with a flow rate of 0.4 mL/min was used
for the plasma samples. An isocratic method was used with a mobile phase of 70:30
methanol: 0.01% formic acid in water. A injection volume of 2 μL was analyzed over a 2
minute run time for each sample.
Brain Analysis
Brain samples were weighed and placed in a new microcentrifuge tube. Fifty μL
of Milli-Q was added with 500 ng/L Fluoxetine-d5 HCl. Brains were sonicated using a
probe sonicator at 10% amplitude for 10 seconds. Cold acetonitrile (400 μL) was then
added to the homogenate and placed in a -80°C freezer until the homogenate mixture was
frozen to precipitate the proteins. Samples were then removed from the -80°C freezer and
centrifuged at 14000 RPM for 5 minutes at 4°C. The supernatant was removed and
placed in a new microcentrifuge until the supernatant was frozen to precipitate proteins
and reduce the sample matrix interferences in the samples. The samples were centrifuged
again under the same conditions and the protein precipitation step was performed a third
time before then transferring the supernatant into a new tube for LC-MS/MS analysis.
The LC-MS/MS parameters are shown in Table 4.1. A mobile phase consisting of
0.01% formic acid in water and methanol were used. A gradient method was used starting
with 5% methanol for the first two minutes (Run time: 0-2 minutes), then increasing to
95% methanol for the next 6 minutes (Run time: 2-8 minutes), holding at 95% methanol
for 4 minutes (Run time: 8-12 minutes), and re-equilibrating back to 5 minutes before the
next sample injection (Run time 12-17 minutes). The sample injection volume was 1 μL
and the total run time was 17 minutes. 5-HIAA concentrations in all brain samples were
below the limit of quantitation and could not be differentiated from background noise.
The retention times for the analyzed compounds were as follows: serotonin at 7.2 min,
venlafaxine at 10.1 min, and fluoxetine and fluoxetine-d5 at 10.9 min The limit of
quantitation for serotonin was 150 nM, 20 nM for 5HIAA, citalopram was 78 nM,
sertraline was 6.5 nM, and fluoxetine and fluoxetine-d5 were both 5 nM.
Log D Model Predictions
The log D plasma model developed by Valenti et al. [13] was utilized to predict the
fluoxetine and venlafaxine plasma concentrations using equations 1 and 2 [13].
LogPBlood:water = 0.73 x Log Doct:water – 0.88
Fishplasma= [Aqueous] x PBlood:water
The log D values were determined from ACD/Labs (Ontario, Canada). The software
provided log D titration curves for each antidepressant over a variety of pH values. The
log D for each tank was determined based on the average pH of the tank throughout the 3
d exposure. The average predicted fish plasma concentration for each antidepressant
treatment was then compared to the measured plasma concentration for each treatment.
Bioconcentration Factor Calculations
The bioconcentration factor (BCF) for the brain antidepressant concentrations respective
of the aqueous concentrations were calculated using equation 3 [18] and the plasma
antidepressant BCF was calculated using equation 4.
BCFt= (concentration in tissue [ug/g] / concentration in water [ug/L]) x 10001
1based on water density of 1 g/mL.
BCFp= (concentration in plasma [ug/L]/ concentration in water [ug/L])
Statistical analyses
JMP 10.0 was used to perform all statistical analyses. A least squared means
student t test was run with treatment, time, and treatment*time as the independent
variables to predict fluoxetine plasma concentrations to determine when fluoxetine
equilibrium concentrations were achieved. A one way ANOVA was run to analyze each
brain BCF value by treatment to determine if there were differences in BCF values
among treatments. An ANOVA was used to determine the capabilities of plasma
antidepressant concentrations and brain antidepressant concentration as predictors of
brain serotonin concentrations and time to capture prey.
Results and Discussion
Aqueous Exposure Concentrations
Measured fluoxetine exposure concentrations (mean + SE) were 29 + 4 μg/L, 66 +
3.7 μg/L, and 139 + 5.5 μg/L for the low, medium, and high exposure concentrations,
respectively. Measured venlafaxine exposure concentrations (mean + SE) were 40 + 2.9
μg/L, 223 + 27 μg/L, and 406 + 19 μg/L for the low, medium, and high concentrations,
respectively. The pH of the exposure tanks (mean + SD) was 7.1 + 0.2, temperature was
22 + 1.2°C, and dissolved oxygen was 8.6 + 2.4 mg/L.
Antidepressant Plasma and Brain Partitioning
Fluoxetine was below the detection limit for all control plasma and brain samples.
Within 6-7 hr of exposure to fluoxetine, the plasma fluoxetine concentrations in the HSB
were 138 + 14.3 μg/L, 259 + 68.9 μg/L, and 868 + 230 ug/L for the low, medium, and
high concentrations, respectively. The highest plasma concentrations were observed after
72 hr of exposure to fluoxetine at 1846 + 453 μg/L, 2744 + 167 μg/L, and 5071 + 630
μg/L for the low, medium and high concentrations, respectively. There was no statistical
difference between plasma concentrations at 48 hours and 72 hr among each treatment,
suggesting equilibrium was achieved at 48 hours (Figure 4.2).
Fluoxetine was detected in the HSB brain after 6 hr of exposure and accumulated
in the brain, ranging from 7-31 μg fluoxetine/g brain tissue for the fluoxetine exposure
doses. After 72 hours aqueous exposure, fluoxetine concentrations ranged from 37-198
μg fluoxetine/g brain tissue, for the respective doses (Figure 4.3). The brain
bioconcentration factor at 72 hr respective to the aqueous exposure was 1466 and did not
differ among exposure concentrations (p=0.39).
Venlafaxine plasma concentrations after 72 hr exposure were 358 + 3.34, 1562 +
25.5, and 1995 + 104 μg/L for the low, medium, and high exposures, respectively (Table
4.2). The control plasma and brain samples were below the limit of detection for
venlafaxine. Venlafaxine brain concentrations ranged 9-199 ng venlafaxine/g brain tissue
for the low, medium, and high aqueous exposures, respectively, at 72 hours (Table 4.2).
The brain bioconcentration factor for venlafaxine was 0.25 and did not differ among
exposure concentrations (p=0.197 for venlafaxine).
The results provided evidence that both antidepressants concentrated in the HSB
plasma within 6 hrs. Fish in effluent dominated streams may be exposed to pulsed
releases of antidepressants from WWTPs, and thus it is possible these antidepressants
may concentrate in the target organ in a short or pulsed exposure. Fluoxetine accumulated
in the HSB plasma and brain tissues to a higher degree than venlafaxine. The log Kow
values of these two compounds may explain the differences in partitioning, since the pH
of the system used for each exposure was the same. The greatest partitioning from the
aqueous phase was into the plasma of the fish. The plasma BCF of 8 determined for
venlafaxine in this study is in agreement with Grabicova et al. [10]; however, the brain
BCF value found in this study (0.25 + 0.03) was significantly lower than the BCF of 9 at
an average pH 7.5 determined by Grabicova et al. [10]. The fluoxetine BCF values
(BCFp: 57 + 8.2, BCFt: 1466 + 339) were higher in this study than the BCF of 74 at an
average pH 7.4 reported by Paterson and Metcalfe [19] in Japanese Medaka. Other
studies have found fluoxetine to partition to a greater extent into fish than venlafaxine
with fish exposed to effluents [3,10].
Log D Model Predictions
The average log D values for venlafaxine throughout the exposure was 2.24 and
for fluoxetine was 2.20 (ACD/Labs, Toronto, Canada); thus, not different for the two
compounds. Therefore, the model predicted similar partitioning for the two compounds
with differences attributed to different aqueous exposure concentrations. The log D
plasma model [13] accurately predicted the low and medium venlafaxine treatment mean
plasma concentrations, but the measured plasma venlafaxine in the high venlafaxine
treatment exceeded the model's prediction by about 2 fold. The measured fluoxetine
plasma concentrations were on average about an order of magnitude higher than those
predicted by the model (Figure 4.4). The greater partitioning by fluoxetine may be
explained by the higher log Kow value for fluoxetine (1.22) versus venlafaxine (0.43)
[11]. The use of Huggett et al.'s [14] fish plasma model to predict fluoxetine plasma
concentrations, which differs from the log D plasma model only by the use of log Kow
values instead of log D values, still under predicted fluoxetine plasma partitioning (data
Valenti's log D plasma model [13] was developed to predict the SSRI
antidepressant sertraline, but this is the first study to test the model's predictive
capabilities with other antidepressants. The model was accurate in predicting
venlafaxine's plasma partitioning at aqueous concentrations less than 165 μg/L; however,
it was not predictive of fluoxetine's plasma partitioning in this experiment.
Internal Dose Correlations
Brain serotonin concentrations decreased over the three day exposure for both
fluoxetine and venlafaxine exposures (Figure 4.5).The brain serotonin concentrations
determined in this study were significantly higher than the concentrations reported by
Gaworecki and Klaine [15] (p<.001) and Bisesi et al. [16] (p<.001) on day three of their
experiments; however, there was no difference in the percentage decreases in brain
serotonin when normalized to controls between this study and those studies ([16] data
p=0.8083; [15] data p=.9837). These concentration differences are likely due to different
extraction and analytical procedures and the data are presented as a function of a change
in brain serotonin from controls.
The plasma and brain antidepressant concentrations on day 3 for each drug were
analyzed as predictor variables of two endpoints: change in brain serotonin
concentrations and time to capture prey. Time to capture prey 1 and 2 data were also
correlated with antidepressant plasma and brain concentrations (Figures 4.6 and 4.7). The
brain antidepressant concentration was a stronger predictor of time to capture prey than
plasma antidepressant concentrations (venlafaxine prey 1: plasma p=0.0464, brain
p=0.0006; venlafaxine prey 2: plasma p=0.2216, brain p=0.0120; fluoxetine prey 1:
plasma p=0.5355, brain p= 0.0706; fluoxetine prey 2: plasma p=0.2167, brain p=0.0547).
Fluoxetine plasma and brain concentrations were both significant predictors of brain
serotonin (plasma: p=0.0039 and R2=0.86; brain: p=0.0046, R2=0.88). Venlafaxine
plasma and brain concentrations were also correlated with brain serotonin levels;
however, this relationship was nonlinear, resulting in a leveling out of serotonin at the
medium and high treatments (plasma: p=0.0632 and R2=0.95; brain: p=0.0493, R2=0.95).
These results coincide with the results from Bisesi et al. [16] that venlafaxine caused
brain serotonin levels to reach a hypothesized basal level at the medium and high
concentrations, thus resulting in nonlinear relationships with time to capture prey and
aqueous exposures.
The strong correlation between brain antidepressant concentration and changes in
brain serotonin concentration provides valuable insight into predicting a variety of effects
in aquatic organisms. Menningen et al. [20] provided a detailed review, highlighting the
highly conserved nature of the serotonin reuptake transporter in vertebrate species and the
important role of serotonin in a variety of physiological functions. Briefly, serotonin is
known to exert effects on specific neuroendocrine pathways in many mammals. Similarly,
serotonin is involved in some fish neuroendocrine pathways, specifically shown in
goldfish and croaker, to stimulate luteinizing hormone to stimulate reproduction [20].
Further, serotonin alterations have been correlated with changes in behavior, by altering
feeding behavior [15-17], locomotion [21], and aggression [22]. Few studies have
correlated an internal antidepressant dose with observed adverse effects. These data
provide information that when the brain fluoxetine concentration reaches a concentration
of about 36 ug/g tissue, brain serotonin concentrations decrease by about 14%. The small
sample size in my experiment and inherent variability of behavior did not elucidate a
significantly increased time to capture prey for fluoxetine exposures. However, Gaworecki
and Klaine [15] reported an increased time to capture prey for the low, medium, and high
doses on day 3 which also corresponded to a 13.5% decrease in brain serotonin
concentrations from controls. Further, brain venlafaxine concentrations of 0.010 ug/g
tissue caused a 30% decrease in brain serotonin concentrations from controls. The high
venlafaxine exposure caused a significant increase in time to capture prey 1 (p=0.005) and
prey 2 (p=0.0225) when the mean brain venlafaxine concentration was 0.104 ug/g + 0.008,
corresponding to about a 50 percent decrease in brain serotonin concentrations from
controls, in my study. The only other study to document an internal antidepressant dose
with adverse effects in aquatic organisms was by Valenti et al. [13]. The authors
documented a decreased time spent under shelter with at an internal plasma dose of
sertraline (an SSRI antidepressant) as low as 3 μg/L for 28 days in the fathead minnow
[13]. Understanding the relationship between antidepressant bioavailability and changes in
brain serotonin concentrations may provide a foundation to predict other adverse effects in
other species and behaviors regulated by serotonin.
Though the exposure concentrations used in these experiments are higher than
environmentally relevant concentrations, these studies provided information on
partitioning of the respective drugs into plasma and the target tissue, the brain. Since
fluoxetine and venlafaxine started to concentrate in the fish plasma within 6 hours of
exposure, it is possible that fish in effluent dominated streams may still be at risk of
adverse effects even with pulsed exposures from wastewater treatment effluent. An
approach developed by Huggett et al. [14] was developed to predict if pharmaceuticals
reached the human therapeutic dose in fish in the aquatic environment. By comparing the
human therapeutic plasma concentration of these antidepressants to the fish plasma
concentrations provides a plasma effect ratio. If the ratio is less than or equal to one, it
insinuates a receptor mediated effect is likely in the nontarget organism, since the drug
has reached or exceeded the intended therapeutic dose in humans [14]. If the ratio is more
than one, then a receptor mediated effect is less likely, since the concentration in the
nontarget organism is less than the intended therapeutic dose. Using a conservative dose
of 500 ng/mL [23] for fluoxetine as the human therapeutic plasma concentration and the
reported plasma concentrations found in this study, the plasma effect ratio for fluoxetine
is 0.1-0.3 for the range of exposure concentrations. Using a conservative estimate of 400
ng/mL [23] for venlafaxine, the plasma effect ratio was 0.2-1.1 for the aqueous
exposures. Therefore, since these effect ratios fell below the 1 threshold, it is apparent
why effects were observed on brain chemistry and behavior in the HSB. These
calculations do not take into consideration active metabolites of either drugs or mixtures
of several antidepressant, which should be addressed in future studies.
Summary and Conclusions
This research provided evidence that the bioavailability of antidepressants is strongly
correlated with changes in brain chemistry and predatory behavior. There have been
several field studies quantifying antidepressants in many streams across North America
and in several fish tissues [3-9], specifically the brain. However, it is important to
understand how the aqueous concentration correlates with an internal dose in the
organism, and the internal dose required to cause an adverse effect that may affect an
organism's fitness. Further, gaining a more robust understanding of how internal doses
affect changes in brain chemistry and more fitness related behaviors in fish will help
scientists make predictions on other potential adverse effects that may be caused by the
presence of antidepressants in the aquatic environment.
TABLES AND FIGURES
Table 4.1. LC-MS/MS MRM optimization parameters for the antidepressants and
neurotransmitters in the brain and plasma samples.
Compound
Precursor
Dwell Time
(V) Q3(V)
Table 4.2. Aqueous, plasma, and brain concentrations of both fluoxetine and
venlafaxine after 3 days exposure to the HSB. Values represent the mean + standard
error concentration for each treatment in the respective matrix at the 72 hr time point.
Fluoxetine
Nominal exposure (μg/L) [Aqueous] (μg/L) [Plasma] (μg/L) [Brain] (μg/g)
Venlafaxine
Nominal exposure (μg/L) [Aqueous] (μg/L) [Plasma] (μg/L) [Brain] (μg/g)
ND: Not detected.
Figure 4.1. The molecular structures of fluoxetine and venlafaxine.
Fluoxetine plasma partitioning
Time (hours)
Figure 4.2. Fluoxetine plasma partitioning in the HSB over 72 hours. The plotted values represent the mean + standard
error for each treatment at each time point. The plasma fluoxetine concentrations among each treatment were not different at
48 hours and 72 hours, as determined by a student's t test.
Figure 4.3. Brain fluoxetine partitioning in the HSB after 6 hours and 72 hours of aqueous exposure. The plotted values
represent the mean + standard error brain fluoxetine concentrations for the different treatments at 6 hour and 72 hour time
Log D partitioning model
Linear (Venlafaxine model)
Linear (Fluoxetine model)
Aqueous concentration (μg/L)
Figure 4.4. Comparisons of the plasma partitioning data with the log D plasma model. The data collected in this study
(data points) were compared with the predicted plasma concentrations (solid lines) from the log D plasma model by Valenti et
al. (2012). Venlafaxine appeared to fit the model at the low and medium exposure concentrations, while fluoxetine plasma
concentrations were an order of magnitude greater than the predictions of the model.
[Brain antidepressant] (ug/g tissue)
erotoni ols
y = -0.112x - 10.152
e in br om c
ng fr -50
cha
y = 6233.6x2 - 938.84x - 21.211
Figure 4.5. Brain antidepressant concentrations as predictors of change in brain serotonin. Brain fluoxetine and
antidepressant concentrations in the HSB strongly correlated with changes in brain serotonin concentrations in a linear
response for fluoxetine and a nonlinear relationship for venlafaxine. It appears saturation occurred with decreases in the brain
serotonin concentrations at the medium and high venlafaxine brain concentrations, similar to what was observed by Bisesi et
al. (2014). Plotted values represent the mean + SE of brain antidepressant and mean + SE change in brain serotonin
concentrations from controls for the low, medium, and high treatments of the antidepressants at 72 hours.
Brain fluoxetine as a predictor of time to capture prey
pture p nds)
Brain fluoxetine (ug/g tissue)
Figure 4.6. Fluoxetine brain concentrations correlated with time to capture prey by the HSB. Fluoxetine had a linear
relationship with the HSB time to capture prey. Data points represent mean + standard error for time to capture prey 1 and prey
2, and brain fluoxetine concentrations.
Brain venlafaxine as a predictor of time to capture prey
pture p nds) 800
o ca
(seco 600
Brain venlafaxine (ug/g tissue)
Figure 4.7. Venlafaxine brain concentration correlated with time to capture prey in the HSB. Data points represent mean
+ SE time to capture prey 1 and prey 2 and venlafaxine brain concentrations in the HSB. This nonlinear relationship between
brain venlafaxine and time to capture prey was also observed with venlafaxine's correlation with changes in brain serotonin.
CITATIONS
1. Corcoran, J., Winter, M. J., & Tyler, C. R. 2010. Pharmaceuticals in the aquatic
environment: A critical review of the evidence for health effects in fish. Critical
Reviews in Toxicology, 40(4), 287-304.
2. Pratt LA, Brody DJ, Gu Q. 2011. Antidepressant use in persons aged 12 and over:
United States, 2005–2008. NCHS data brief, no 76. National Center for Health
Statistics, Hyattsville, MD.
3. Schultz MM, Furlong ET, Kolpin DW, Werner S L, Schoenfuss HL, Barber LB.
2010. Antidepressant pharmaceuticals in two US effluent-impacted streams:
Occurrence and fate in water and sediment, and selective uptake in fish neural
tissue. Environmental Science & Technology 44:1918-1925.
4. Schultz MM, Furlong ET. 2008. Trace analysis of antidepressant pharmaceuticals
and their select degradates in aquatic matrixes by LC/ESI/MS/MS. Analytical
Chemistry 80: 1756-1762.
5. Brooks BW, Chambliss CK, Stanley JK, Ramirez A, Banks KE, Johnson RD.
2005. Determination of select antidepressants in fish from an effluent-dominated
stream. Environmental Toxicology and Chemistry 24:464-469.
6. Metcalfe CD, Chu S, Judt C, Li H, Oakes KD, Servos MR. 2010. Antidepressants
and their metabolites in municipal wastewater, and downstream exposure in an
urban watershed. Environmental Toxicology and Chemistry 29:79-89.
7. Kreke N, Dietrich DR. 2008. Physiological endpoints for potential SSRI
interactions in fish. CRC Critical Reviews in Toxicology 38:215-247.
8. Lajeunesse, A., Gagnon, C., Gagné, F., Louis, S., Čejka, P., & Sauvé, S. (2011).
Distribution of antidepressants and their metabolites in brook trout exposed to
municipal wastewaters before and after ozone treatment–Evidence of biological
effects. Chemosphere, 83(4), 564-571.
9. Ramirez, A. J., Brain, R. A., Usenko, S., Mottaleb, M. A., O'Donnell, J. G., Stahl,
L. L., Wathen, J.B., Snyder, B.D., Pitt, J.L., Perez‐Hurtado, P., Dobbins, L.L.,
Brooks, B.W., & Chambliss, C.K. (2009). Occurrence of pharmaceuticals and
personal care products in fish: Results of a national pilot study in the United
States. Environmental Toxicology and Chemistry, 28(12), 2587-2597.
10. Grabicova, K., Lindberg, R. H., Östman, M., Grabic, R., Randak, T., Larsson, D.
J., & Fick, J. (2014). Tissue-specific bioconcentration of antidepressants in fish
exposed to effluent from a municipal sewage treatment plant. Science of the Total
Environment, 488, 46-50.
11. Vasskog, T., Anderssen, T., Pedersen-Bjergaard, S., Kallenborn, R., & Jensen, E.
(2008). Occurrence of selective serotonin reuptake inhibitors in sewage and
receiving waters at Spitsbergen and in Norway. Journal of Chromatography A,
1185(2), 194-205.
12. Valenti, T. W., Perez‐Hurtado, P., Chambliss, C. K., & Brooks, B. W. (2009).
Aquatic toxicity of sertraline to Pimephales promelas at environmentally relevant
surface water pH. Environmental Toxicology and Chemistry, 28(12), 2685-2694.
13. Valenti Jr, T. W., Gould, G. G., Berninger, J. P., Connors, K. A., Keele, N. B.,
Prosser, K. N., & Brooks, B. W. (2012). Human therapeutic plasma levels of the
selective serotonin reuptake inhibitor (SSRI) sertraline decrease serotonin
reuptake transporter binding and shelter-seeking behavior in adult male fathead
minnows. Environmental Science & Technology, 46(4), 2427-2435.
14. Huggett, D., Cook, J., Ericson, J., & Williams, R. (2003). A theoretical model for
utilizing mammalian pharmacology and safety data to prioritize potential impacts
of human pharmaceuticals to fish. Human and Ecological Risk Assessment, 9(7),
15. Gaworecki, K. M., & Klaine, S. J. (2008). Behavioral and biochemical responses
of hybrid striped bass during and after fluoxetine exposure. Aquatic Toxicology,
88(4), 207-213.
16. Bisesi Jr, J. H., Bridges, W., & Klaine, S. J. (2014). Effects of the antidepressant
venlafaxine on fish brain serotonin and predation behavior. Aquatic Toxicology,
148, 130-138.
17. Bisesi Jr. JH, Sweet LE, van den Hurk P, Klaine SJ. Accepted to ET&C with
major revisions. Effects of an antidepressant mixture on the brain chemistry and
predatory behavior of hybrid striped bass.
18. Schwarzenbach, R.P.; Gschwend, P.M.; Imboden, D.M. Environmental Organic
Chemistry, Second Edition. John Wiley & Sons, New York, NY; 2003.
19. Paterson, G., & Metcalfe, C. D. (2008). Uptake and depuration of the anti-
depressant fluoxetine by the Japanese medaka (Oryzias latipes). Chemosphere,
74(1), 125-130.
20. Mennigen, J. A., Stroud, P., Zamora, J. M., Moon, T. W., & Trudeau, V. L.
(2011). Pharmaceuticals as neuroendocrine disruptors: Lessons learned from fish
on Prozac. Journal of Toxicology and Environmental Health, Part B, 14(5-7),
21. Lowry, C. A., & Moore, F. L. 2006. Regulation of behavioral responses by
corticotropin-releasing factor. General and Comparative Endocrinology, 146(1),
22. Summers, C. H., Korzan, W. J., Lukkes, J. L., Watt, M. J., Forster, G. L., Øverli,
Ø., Hoglund, E.; Larson, E.T., Ronan, P.J., Matter, J.M., Summers, T.R., Renner,
K.J., & Greenberg, N. 2005. Does serotonin influence aggression? Comparing
regional activity before and during social interaction. Physiological and
Biochemical Zoology, 78(5), 679-694.
23. Schulz, M., & Schmoldt, A. (2003). Therapeutic and toxic blood concentrations
of more than 800 drugs and other xenobiotics. Die Pharmazie-an International
Journal of Pharmaceutical Sciences, 58(7), 447-474.
CHAPTER FIVE
THE EFFECTS OF AN ENVIRONMENTALLY RELEVANT SSRI MIXTURE
ON HYBRID STRIPED BASS BRAIN CHEMISTRY AND PREDATORY
BEHAVIOR
In 2010, approximately 48% of Americans took at least one prescription drug
each month [1]. The number had risen to 70% by 2013 [2]. Antidepressants are the third
most prescribed pharmaceutical class [1]. Widespread use coupled with incomplete
removal during wastewater treatment processes has led to several antidepressants, with
similar mechanisms of action, detected in many effluent dominated streams across the
U.S. [3-7]. Selective serotonin reuptake inhibitors (SSRIs) and serotonin and
norepinephrine reuptake inhibitors (SNRIs) have previously been shown to cause effects
on brain serotonin concentrations and predatory behavior in the hybrid striped bass [8,9],
with evidence of additivity in both responses when bass were exposed to a mixture of
fluoxetine (SSRI) and venlafaxine (SNRI) [10]. Bass exposed to a norepinephrine and
dopamine reuptake inhibitor (NDRI) did not show an effect on predatory behavior,
though it did alter brain norephinephrine concentrations (Sweet et al., dissertation chapter
2). Many of the drugs detected in the aquatic environment are SSRIs, with many of their
metabolites also detected in effluent dominated streams. Some of these metabolites have
displayed similar potency to the parent SSRI with their affinity for binding to the
serotonin reuptake transporter [11]. Therefore, it is apparent that these compounds are
entering the environment in complex mixtures, and the need to characterize the potential
risk of these mixtures is apparent.
Few studies have characterized the effects of antidepressant mixtures on aquatic
organisms. Bisesi et al. [10] found evidence of additivity for decreased brain serotonin
levels and increased time to capture prey when the hybrid striped bass were exposed to a
mixture of fluoxetine and venlafaxine, though at higher than environmentally relevant
concentrations. Painter et al. [12] found that predator avoidance behavior in larval fathead
minnows was negatively affected by an environmentally relevant antidepressant mixture
exposure. However, reproductive behavior in male fathead minnows was not altered by
similar mixture exposure concentrations [13]. Therefore, it is clear that more research is
needed to better characterize the effects of antidepressant mixtures on ecologically
relevant endpoints.
The objective of this research was to characterize the effects of antidepressant
mixtures of SSRIs on hybrid striped bass brain chemistry and predator behavior. The
SSRIs sertraline, citalopram, and fluoxetine (Figure 5.1) were chosen for the
antidepressant mixture for the exposure. These three SSRIs have been detected in the
aquatic environment, and detected in brain, liver, and muscle tissues in fish and other
aquatic organisms sampled from effluent dominated streams [4,6, 14]. Our hypothesis
was that these antidepressants would act in an additive manner because they have the
same mode of action, resulting in decreases in brain serotonin concentrations in hybrid
striped bass. Fathead minnows exposed to sertraline spent less time under shelter than
control fish, suggesting sertraline caused an anxiolytic effect in male fathead minnows
[15]. Three-spine stickleback (Gasterosteus aculeatus) feeding was reduced by 30-40%
upon exposure to environmentally relevant concentrations of citalopram [16]. Fluoxetine
exposure caused a decrease in brain serotonin concentrations with a subsequent increase
in time to capture prey in the hybrid striped bass [8]. Fluoxetine has also been shown to
increase time to capture prey in fathead minnows and a decrease in mating behavior by
fathead minnow males [17]. However, many of these exposure concentrations were
significantly higher than those found in streams across the US. These SSRI
antidepressants were chosen for this mixture study given that these drugs have
individually caused adverse effects on fitness related behaviors and are commonly
detected in the aquatic environment
Antidepressant Mixture Concentrations
Antidepressant mixture concentrations used a dose equivalent approach by
incorporating the binding affinity (previously determined, Sweet dissertation chapter 3)
of each antidepressant to the hybrid striped bass serotonin reuptake transporter (SERT),
the target of the antidepressants. Since sertraline had the strongest binding affinity for the
transporter, the highest environmental concentration reported for sertraline (80 ng/L) was
multiplied by the binding affinity of each drug to determine the lowest concentration of
each individual drug in the mixture (Table 5.1). The total SSRI exposure concentration in
the low mixture dose was approximately 2 ug/L, the medium dose was 20 ug/L, and the
highest dose was 100 ug/L. Hereafter, the doses will be referred to as "low," "medium,"
and "high" exposures (Table 5.1). This dose equivalency approach allowed me to test if
the SSRI mixture was working in an additive manner despite not performing individual
studies on sertraline and citalopram. Since I have quantified the effects of fluoxetine on
brain chemistry and predatory behavior using this same experimental design [8; Sweet,
dissertation chapter 4], I can make predictions for each drug based on their binding
affinity relative to fluoxetine. For example, the binding affinity of sertraline was found to
be Ki = 1 + 2 nM, suggesting that it is 4x more potent at the SERT than fluoxetine (Ki = 4
+ 2 nM), while citalopram is 5x less potent at the SERT than fluoxetine (Ki = 21 + 6 nM).
Thus, based on the amount of fluoxetine that accumulated in the HSB brain during the
mixture exposure, predictions can be made on changes in brain serotonin from controls
using the following equation: y = 0.0011x2 - 0.3546x, where y= percent change in brain
serotonin and x= fluoxetine brain concentration (μg/g tissue). The predicted change in
serotonin values for fluoxetine was then multiplied by 4 to represent the sertraline
predicted change in serotonin values, and divided by 5 to represent the citalopram
predicted change in serotonin values (Table 5.2). The predicted change in brain serotonin
values for each antidepressant were totaled to produce a predicted total change in brain
serotonin (%) and these values were compared to the observed percent change in brain
serotonin (%). Predicted versus observed decreases in serotonin were used to determine
additivity versus non-additivity. Observed values that were statistically different than
predicted were deemed non-additive. In the case of non-additive responses, if the
predicted values fell within the observed + standard deviation values, the response was
determined to be additive. If the predicted values were greater than the observed +
standard deviation, the response was determined to be less than additive.
Behavioral Bioassay
Hybrid striped bass were cultured in flow through systems with source water from
Lake Hartwell, SC, USA (pH=6.88 + 0.17, hardness 24 mg/L as CaCO3, alkalinity 10
mg/L as CaCO3), as previously described. The bass were fed a high protein, sinking,
pelleted feed (Silver Cup Fish Feed, Nelson & Sons, Inc., Tooele, UT, USA) until they
were the appropriate size for the study (23.2 + 2.7 cm, 133 + 52 g). Bass were first
trained to eat fathead minnows in a group setting. Bass selected for the experiment were
placed in a 300 L flow through holding tank. The bass were fed four minnows per bass
every three days, for a total of 3 group training feeding events. After the third group
training feeding, bass were transferred into individual 80 L flow through aquaria with the
same source water. During individual training feedings, bass were fed four minnows per
bass with a researcher timing the time it took the bass to capture each one of the four
minnows with a stopwatch. The bass underwent three timed, individual training feedings
and only bass that ate all four minnows consistently in the individual training events were
selected for the experiment. The third individual training event corresponded to Day 0 of
The bass were exposed to a methanol control, low, medium, and high SSRI
mixture (Table 1) for 6 days in a static system and a 6 day recovery, flow through system.
The bass were fed four fathead minnows every three days during the experiment, with
time to capture prey quantified at each feeding event. Following each feeding event, 5
bass per treatment were removed from the experiment, euthanized with buffered MS222,
blood drawn for plasma antidepressant concentration analysis, and brains were dissected
for brain chemistry analysis and antidepressant concentrations.
Chemicals
Fluoxetine hydrochloride was donated by Fermion (Finland). Citalopram
hydrobromide (TCI Chemicals), sertraline hydrochloride (TCI Chemicals), acetone,
HPLC grade methanol, glacial acetic acid, trace metals grade hydrochloric acid,
triethylamine, Optima® LC-MS methanol and Optima® LC-MS formic acid were
purchased from Fisher Scientific. Fluoxetine –d5 hydrochloride was purchased from CDN
Isotopes (Quebec, Canada). MS-222 was purchased from Pentair Aquatic Habitats
(Apopka, FL, USA). Serotonin creatinine sulfate complex, 5-hydroxyindoleacetic acid
(5-HIAA), and Fluka LC-MS Chromasolv® water were purchased from Sigma Aldrich
(St. Louis, Missouri, USA). Water used for analytical procedures (excluding the LC-
MS/MS) was purified by a Milli-Q Super-Q Filtration (Millipore™, Billerica, MA, USA)
system with a resistivity of 18 MΩ.
Antidepressant Exposure
Antidepressant stock solutions were prepared by weighing out fluoxetine,
citalopram, and sertraline and dissolving each drug in methanol. The stock solution
concentrations were determined to ensure <0.1 mg/L methanol in the exposure tanks
(ASTM E1241-92). From these methanol stocks, each drug was added to prepare a
concentrated, 1 L dosing solution of the antidepressant mixture in Milli Q prior to each
exposure (67.2 mg/L citalopram, 3.2 mg/L sertraline, and 12.8 mg/L fluoxetine). From
this 1L dosing solution, 100 mL was added to the high treatments, 20 mL was added to
the medium treatments, and 2 mL was added to the low treatments. A similar methanol
control solution was prepared with the same amount of methanol added as in the
antidepressant dosing solution, in Milli Q water. All control tanks were spiked with 100
mL of this methanol control solution.
A half life experiment was performed prior to the start of any experiments at a
concentration of 150 μg/L of each antidepressant to ensure all compounds could be
detected by the HPLC. All antidepressants were found to have a half life around 72
hours. As a result, all tanks were respiked with half the concentration following the same
approach as previously described with freshly prepared solutions. The stock solutions
before each experiment and high mixture exposures during the static period of the
experiment were quantified by solid phase extraction on a Waters HLB Oasis column
(SPE recoveries were 90% for citalopram, 80% for fluoxetine, and 87% for sertraline).
SPE columns were prepared with 1 volume acetone, 1 volume methanol, and 2 volumes
water. Water samples were acidified to pH 3 and concentrated on the SPE column.
Samples were eluted with 99% methanol 1% acetic acid. Eluted samples were analyzed
on an HPLC with absorbance detection (214 nm) and fluorescence detection (excitation
238 nm, emission 300 nm). Mobile phase consisted of 50:40:10:0.3:0.15 Water:
Methanol: Acetonitrile: Triethylamine: Acetic acid at a flow rate of 1 mL/min and an
injection volume of 40 μL.
Brain Analysis
Brain samples were dissected and stored initially on dry ice until they were
transferred to a -80°C freezer until analysis. Brains were weighed and placed in a new
microcentrifuge tube. Fifty μL of Milli-Q was added with 500 ng/L Fluoxetine-d5 HCl.
Brains were sonicated using a probe sonicator at 10% amplitude for 10 seconds. Cold
acetonitrile (200 μL) was then added to the homogenate and placed in a -80°C freezer
until the homogenate mixture was frozen to precipitate the proteins. Samples were
removed from the -80°C freezer and centrifuged at 14000 RPM for 5 minutes at 4°C. The
supernatant was then removed and placed in a new microcentrifuge until the supernatant
was frozen to again precipitate any proteins. The samples were centrifuged again under
the same conditions and the protein precipitation step was performed a third time before
then transferring the supernatant into a new tube for LC-MS/MS/ESI analysis. The LC-
MS/MS parameters for brain analysis are showed in Table 5.3. Brain serotonin
concentrations were normalized to protein concentration determined by Pierce BCA
protein assay kit (Life Technologies, Inc). An aliquot of the LC-MS/MS ready sample
was diluted 1:10 with Milli Q water and run using the manufacturer's instructions. Brain
antidepressant concentrations were normalized to brain tissue weight (g).
The mobile phase consisted of 0.01% formic acid in water and methanol. An
isocratic method was run starting with 5% methanol for 2 min, and increasing to 10%
methanol for 2 min (run time: 4 min), increasing to 95% methanol for 2 min (run time: 6
min) and remaining at 95% methanol for 5 min for a total run time of 11 min. After 11
min, the mobile phase reduced back down to 5% methanol over 6 minutes to re-
equilibrate the column prior to the next sample injection. The sample injection volume
was 1 μL and the compound retention times were as follows: Serotonin: 2.9 min,
citalopram: 8.8 min, fluoxetine: 9.0 min, fluoxetine-d5: 9.0 min, sertraline: 9.2 min. Due
to the fast break down of serotonin, samples were loaded 2-3 at a time to ensure the
compounds did not further break down during analysis. The limit of quantitation for
serotonin was 150 nM, citalopram was 78 nM, sertraline was 6.5 nM, and fluoxetine and
fluoxetine-d5 were both 5 nM.
Statistical Analysis
All statistical analysis was performed using JMP 10.0. To analyze the behavioral
data, the data were transformed to log (data) + 1 to reduce data variability for analysis. A
model was run with day, treatment, day*treatment, and tank nested within treatment as a
random variable to analyzed all time to capture prey data. Since one HSB was placed in
each tank, nesting tank within treatment and treating it as a random variable corrected for
the repeated measures of time to capture prey. A least squares mean student's t test was
run to make multiple comparisons of the model output to determine statistical differences
between day, treatment, and treatment by day interactions. A least squares mean
difference student's t test was performed to make multiple comparisons of treatment and
treatment by day effects on the brain data.
Results and Discussion
Water Quality
The average water quality parameters (mean + standard deviation) over the course
of the entire experiment were 21.3 + 1.4° C for temperature, 6.9 + 0.2 for pH, and 8.58 +
2.4 ppm dissolved oxygen. HPLC analysis confirmed that the measured concentrations of
all SSRIs were equal to or greater than 90% of nominal values.
Behavioral Assay
In analyzing the behavioral data, the time it took the HSB to capture each one of
the four fathead minnows was analyzed separately; thus, prey 1 corresponds to the first
fathead minnow the HSB captured, prey 2 corresponds to the second fathead minnow the
HSB capture, prey 3 the third fathead minnow, and prey 4 data is the fourth and last of
the fathead minnows captured. The high mixture treatment was the only treatment to
show statistically significant increases in time to capture prey 1 (Figure 5.2) and time to
capture prey 2 (Figure 5.3). By day 12, all treatments resulted in decreased time to
capture prey 3 (Figure 5.4). The time to capture prey 4 data was very variable and was
not included as no statistical differences were observed from controls.
Given that exposure to serotonin targeting antidepressants decreased brain
serotonin concentrations and increased time to capture prey in the HSB [8-10] at higher
than environmentally relevant concentrations, the goal of this research was to test a series
of mixture exposures that encompassed environmentally relevant concentrations. The low
mixture treatment represented an environmentally relevant mixture and the highest
treatment represented a concentration where previous studies have identified effects on
brain chemistry and predatory behavior [8,9]. These predatory behavior results correlated
with the results from Gaworecki and Klaine [8] in that exposures to fluoxetine at
concentrations of 35 μg/L (and higher) caused significant increases in time to capture
prey by the HSB on day 6 and day 9. These results also correlated with predatory
behavior results from Bisesi et al. [9] in that exposure to a serotonin targeting
antidepressant, venlafaxine, caused significant increases in time to capture prey 3 on day
12 by exposures of 50 μg/L and higher. The effects on time to prey 3 observed in the
current study and previous studies [8-10] suggest that alteration of serotonin may have an
affect on appetite suppression. The majority of bass that did not consume all four fathead
minnows often displayed no interest in eating the fathead minnows. The minnows would
swim right in front of the HSB with no reaction or attempt to consume the minnows,
suggesting that perhaps the HSB appetite may be suppressed. The presence of SERT in
HSB stomach samples was confirmed in Chapter 3 of this dissertation. Other qualitative
observations in previous studies [8-10] documented the HSB positioning itself vertically
in the water column and slowly swimming along the surface; however, these effects were
not observed in the current SSRI mixture exposure.
Brain Chemistry
The brain serotonin concentrations in this study ranged from 0.1-1.6 ng/μg. Brain
serotonin concentrations decreased from controls by approximately 44% + 11% (mean +
SE) for the medium mixture treatment on Day 3 (Figure 5.5). Despite no differences in
brain serotonin concentrations on day 6 in any treatment, the high treatment showed a
significant increase in time to capture prey 1, 2, and 3 on day 6. On day 9, the medium
and high mixture treatments significantly decreased brain serotonin concentrations by
83.5 + 5% and 83 + 7% from controls, respectively. With the significant decrease in HSB
brain serotonin concentrations in the high treatment, increased time to capture prey 1 and
prey 2 was observed in this treatment on day 9. On day 12, the low, medium, and high
brain serotonin concentrations were significantly decreased by 40 + 3, 80 + 4, and 69 +
4% from controls, respectively. With this decrease in brain serotonin in the low, medium,
and high mixture treatments on day 12, an increased time to capture prey 1, prey 2, and
prey 3 was also observed in these treatments. A statistically significant dose-dependent
relationship was observed for time to capture prey 3 on day 12 as a function of brain
serotonin concentrations (Figure 5.6). Gaworecki and Klaine [8] and Bisesi et al. [9]; also
reported this same relationship; however, they observed this on day 6 when the lowest
brain serotonin concentrations were detected in those studies. This relationship was not
present on day 6 of this study since there were no statistically significant decreases in
brain serotonin from controls. The max decrease in brain serotonin of 83.6% in this study
is much higher than maximum value of 49.1% decrease on day 6 reported by Gaworecki
and Klaine [8] for HSB exposed to fluoxetine. This significant decrease in brain serotonin
levels may be due to the linear relationship of fluoxetine in decreasing brain serotonin {8;
Sweet dissertation chapter 4] coupled with potentially linear effects of sertraline and
citalopram on brain serotonin (though not tested in this study). Valenti et al. [15] found
that long term exposure to sertraline caused significant decreases in the number of SERT
binding sites in fathead minnow brain homogenates, suggesting a down regulation of the
SSRI antidepressant target with chronic treatment. Though the endpoint was not
examined in my study, the results of Valenti et al. [15] provide evidence that SERT down
regulation may be occurring and contributing to the large percent decrease in brain
serotonin in the hybrid striped bass brain given that sertraline was a component of this
Brain Antidepressant Concentrations
Antidepressants were detected in the exposed fish brain tissues throughout the
exposure and recovery periods (Figure 5.7). Antidepressants were not detected in any of
the control fish throughout the experiment. Citalopram brain concentrations in the low
treatment were below the limit of quantitation throughout the experiment; thus, the low
treatment SSRI summations are only representative of the sum fluoxetine and sertraline
concentrations. The sum of the antidepressants in the HSB brain was highest on day 6,
with mean concentrations (+ SE) 944 + 510 ng/g tissue, 6443 + 580 ng/g tissue, and
60630 + 8400 ng/g tissue for the low, medium, and high mixture treatments. During the
recovery period, brain antidepressant concentrations decreased; however, on day 12, after
6 days of clean, flow through water, brain antidepressant concentrations means were 16 +
8.1 ng/g tissue, 564 + 167 ng/g tissue, and 1512 + 244 ng/g tissue for the low, medium,
and high mixture treatments. The fact that the antidepressants remained in the HSB brain
throughout the recovery period may explain why brain serotonin levels were still altered
on day 9 and day 12, as well as time to capture prey being altered on day 12. Further, the
individual antidepressant brain bioconcentration factors (determined by [concentration in
brain tissue ng/g]/[concentration in water ng/L] x1000, based on water density of 1 g/mL
[5], for the highest treatment on day 6 was 47 for citalopram, 2005 for fluoxetine, and
1476 for sertraline. Thus, even though citalopram was dosed at a 21x greater
concentration than sertraline in the mixture, sertraline had a higher bioconcentration
factor (BCF) in the brain than citalopram. The similar BCF for fluoxetine and sertraline
may be explained by similar binding affinity for the SERT transporter in the HSB brain
homogenate (Table 5.1). Further, the log Kow values reported in the literature also
correlated with the brain bioconcentration factors found in this study (citalopram log Kow
=3.74; sertraline log Kow =5.29; fluoxetine log Kow =4.05) [18]. Thus, given that
citalopram's log Kow value is lower than fluoxetine and sertraline, it is not surprising that
it partitioned into the HSB brain to a lesser extent than fluoxetine and sertraline. The BCF
values reported in this study are on average 10x greater than those reported by Lajeunesse
et al. [5] and Grabicova et al. [18]. The fish were exposed to 20% diluted effluents with
aqueous concentrations of 0.58 ng/L fluoxetine, 1.1 ng/L sertraline and10.5 ng/L
citalopram [5] and 18 ng/L fluoxetine, 260 ng/L citalopram, an 53 ng/L sertraline [18] in
those studies. Thus, these differences may be attributed to different experimental designs
and over 100-800x higher exposure concentrations in this study.
Determination of Additivity
While individual exposures of sertraline or citalopram to the HSB have not been
performed using this same bioassay, the effects of fluoxetine on HSB brain chemistry
have been previously studied [8; Sweet dissertation chapter 4]. Hence, changes in brain
serotonin concentrations were predicted based on the fluoxetine brain concentrations for
each brain throughout the experiment. Sertraline and citalopram's predictions were made
from fluoxetine predictions and normalized to their respective binding affinity. These
were used to predict the total expected decrease in serotonin from exposure to the mixture
(Table 5.2). Predicted versus observed decreases in serotonin were used to determine
additivity versus non-additivity. Statistical analyses were performed for the predicted and
observed values for each HSB brain to account for variability in determining statistical
differences. Observed values that were statistically different than predicted were deemed
non-additive. Non-additive results were generally greater than additive, with the few
exceptions of the low and high treatments on day 3 which were additive, the high
treatment on day 6 was less than additive, and the low treatment on day 9 was additive.
These results suggest that time may be a factor in generating a greater than additive
response for the low and high treatments. Though the antidepressant is accumulating in
the brain, brain serotonin levels may not be affected in a greater than additive response
until days 9 and 12. However, it is noted that there are uncertainties in using this
prediction approach. Though the regression equation used to determine the predicted
fluoxetine change in brain serotonin had a tight fit to the data (R2=0.98), it was based on
a bioavailability study with low replicate numbers (n=3 for three treatments) and higher
exposure concentrations ranging from 35-150 μg/L (Sweet, dissertation chapter 4). The
fluoxetine brain concentration (μg/g) for each HSB brain on each exposure day was used
to predict the change in brain serotonin concentration. The mean binding affinity values
for each antidepressant were also used, neglecting values at the high or low standard
deviations from these mean values for each antidepressant. However, despite the
uncertainties, this approach provided a way to make an objective conclusion that was
supported by statistical analysis. Future studies should include treatments with individual
compounds to provide insight into the predictive power of my approach.
Conclusions
The fact that my results yielded greater than additive conclusions in some of the
treatments raises ecological concerns about the presence of complex mixtures of
serotonin altering drugs in the environment. The greater than additive effects may be
partially explained by the linear relationship between brain fluoxetine concentrations and
decreases in brain serotonin concentrations (Sweet dissertation chapter 4). Though
individual exposures have not been performed to elucidate the relationship of sertraline
and citalopram on brain serotonin concentrations, one may hypothesize that since they
are also SSRIs they may also have a linear response to brain serotonin, resulting in
greater than additive effects. While the exposure concentration of any one SSRI might be
below adverse effects levels, the complex mixture of pharmaceuticals in wastewater
effluents may be sufficient to cause adverse effects in fish in the receiving stream.
Serotonin has been shown to be involved in stress reactions, locomotor activity, social
behaviors and dominance hierarchies, reproduction, and feeding behavior in fish [8-
10,19-21], and a reduction in SERT binding sites in fathead minnows was correlated with
altered shelter seeking behavior [15]. Thus, alteration of serotonin by mixtures of
antidepressants acting in a greater than additive manner has the potential to affect a
variety of fitness related physiological functions and behaviors.
TABLES AND FIGURES
Table 5.1. The dosing rational for the SSRI mixture treatments. Each mixture treatment took into account each
antidepressant's binding affinity for the SERT. Since sertraline had the strongest binding affinity (Ki (nM)), the environmental
concentration of sertraline was multiplied by the other antidepressants' binding affinities. The total SSRI concentration was 2
μg/L for the low dose, 20 μg/L in the medium dose, and 100 μg/L in the high dose.
Table 5.2. Determination if the mixture was acting in an additive manner in decreasing brain serotonin concentrations.
The general consensus was that most treatments throughout the 12 day experiment experienced a greater than additive percent
decrease in brain serotonin compared to controls. All values represent mean + SD.
Predicted Predicted Actual %
treatment binding
decrease Conclusion5 p value6
affinity decrease in
decrease decrease
affinity in 5HT2 affinity in 5HT3 in 5HT4 in 5HT
additive
-44.5 + 11 > additive
additive
> additive
> additive
-33.9 + 18 < additive
additive
> additive
> additive
> additive
> additive
> additive
Abbreviations: FLUOX: fluoxetine, SER: sertraline, CIT: citalopram, 5HT:serotonin
1 The predicted fluoxetine change in brain serotonin was derived from previous research that elucidated the percent change in
brain serotonin (y) as a function of fluoxetine brain concentration (μg/g tissue) (x) using the following equation: y = 0.0011x2 -
0.3546x . Using the brain fluoxetine concentrations in the mixture treatments, the predicted percent change in brain serotonin
2 The predicted change in brain serotonin from controls for sertraline was predicted by taking into account that sertraline's
binding affinity was determined to be 4x stronger than fluoxetine's in the bass brain homogenate. Therefore, the predicted
values for sertraline were derived by multiplying the fluoxetine predicted values by 4.
3 The predicted change in brain serotonin from controls for citalopram was predicted by taking into account that citalopram's
binding affinity was determined to be 5x less strong that fluoxetine for the SERT in the bass brain homogenate. Therefore, the
predicted values for citalopram were derived by dividing the fluoxetine predicted values by 5.
4 The total predicted change in brain serotonin from controls was determined by adding up the predicted values of fluoxetine,
sertraline and citalopram.
5 If the total predicted % change in serotonin value fell within the actual mean + standard deviation % change in serotonin, an
additive conclusion of the individual components was determined. If the total predicted concentration was less than the actual
mean + standard deviation % change in brain serotonin, a great than additive conclusion was determined.
6 A one way ANOVA was performed to compare the observed percent change in serotonin and predicted percent change in
serotonin for each treatment, sorted by day. A LS Means student's t test was used to make multiple comparisons among
treatments for the observed and predicted values.
Table 5.3. LC-MS/MS MRM optimization parameters for the antidepressants and serotonin in the HSB brain mixture
samples.
Q3(V) Acquisition Time
Figure 5.1. The molecular structures of fluoxetine, sertraline, and citalopram.
These three antidepressants are all SSRIs and were selected for the mixture exposure.
Figure 5.2. Time to capture prey 1 (in seconds) by HSB exposed to an SSRI mixture. The high mixture treatment was
significantly slower to capture prey than controls on days 6, 9, and 12.
Figure 5.3. Time to capture prey 2 (seconds) by the HSB exposed to an SSRI mixture. The high mixture treatment was
significantly slower to capture prey 2 than controls on days 6, 9, and 12.
Figure 5.4. The time to capture prey 3 (seconds) by HSB exposed to an SSRI mixture. The high mixture treatment was
significantly slower to capture prey 3 from controls on days 6 and 12. All mixture treatments were significantly slower to
capture prey than controls on day 12 of the experiment.
Figure 5.5. The percent change in brain serotonin concentrations compared to controls in the HSB over a 12 day
exposure to an SSRI mixture. Significant changes in brain serotonin concentrations from controls were observed for the
medium treatment on day 3, the medium and high treatments on day 9, and for all treatments on day 12.
Figure 5.6. The decrease in brain serotonin concentrations on day 12 correlated with an increased in time to capture
prey 3. Data points represent mean + standard error. A significant decrease in brain serotonin concentrations from controls was
observed with significant increases in time to capture prey 3 on day 12.
Figure 5.7. The brain total SSRI concentrations over the 12 day mixture experiment. Data points represent mean + SE.
The highest antidepressant concentrations were noted on day 6. On day 12, after six days of recovery, antidepressants were still
detected in the brains of all mixture treatments.
CITATIONS
1. Pratt LA, Brody DJ, Gu Q. (2011). Antidepressant use in persons aged 12 and
over: United States, 2005–2008. NCHS data brief, no 76. National Center for
Health Statistics, Hyattsville, MD.
2. Zhong W, Maradit-Kremers H, St. Sauver JL, Yawn BP, Ebbert JO, Roger VL,
Jacobsom DJ, McGree ME, Brue SM, Rocca WA. (2013). Age and sex patterns of
drug prescribing in a defined American population. Proceedings of the Mayo
Clinic, 88(7), 697-707.
3. Schultz, M. M., Furlong, E. T., Kolpin, D. W., Werner, S. L., Schoenfuss, H. L.,
Barber, L. B., Blazer, V.S., Norris, D.O., & Vajda, A. M. (2010). Antidepressant
pharmaceuticals in two US effluent-impacted streams: Occurrence and fate in
water and sediment, and selective uptake in fish neural tissue. Environmental
Science & Technology, 44(6), 1918-1925.
4. Schultz, M. M., & Furlong, E. T. (2008). Trace analysis of antidepressant
pharmaceuticals and their select degradates in aquatic matrixes by
LC/ESI/MS/MS. Analytical Chemistry, 80(5), 1756-1762.
5. Lajeunesse, A., Gagnon, C., Gagné, F., Louis, S., Čejka, P., & Sauvé, S. (2011).
Distribution of antidepressants and their metabolites in brook trout exposed to
municipal wastewaters before and after ozone treatment–Evidence of biological
effects. Chemosphere, 83(4), 564-571.
6. Brooks, B. W., Chambliss, C. K., Stanley, J. K., Ramirez, A., Banks, K. E.,
Johnson, R. D., & Lewis, R. J. (2005). Determination of select antidepressants in
fish from an effluent‐dominated stream. Environmental Toxicology and
Chemistry, 24(2), 464-469.
7. Metcalfe, C. D., Chu, S., Judt, C., Li, H., Oakes, K. D., Servos, M. R., &
Andrews, D. M. (2010). Antidepressants and their metabolites in municipal
wastewater, and downstream exposure in an urban watershed. Environmental
Toxicology and Chemistry, 29(1), 79-89.
8. Gaworecki, K. M., & Klaine, S. J. (2008). Behavioral and biochemical responses
of hybrid striped bass during and after fluoxetine exposure. Aquatic Toxicology,
88(4), 207-213.
9. Bisesi Jr JH, Bridges W, Klaine SJ. (2014). Effects of the antidepressant
venlafaxine on fish brain serotonin and predation behavior. Aquatic Toxicology,
10. Bisesi Jr. JH, Sweet LE, van den Hurk P, Klaine SJ. (Accepted 2015). Effects of
an antidepressant mixture on the brain chemistry and predatory behavior of hybrid
striped bass. Environmental Toxicology & Chemistry.
11. Owens, M. J., Morgan, W. N., Plott, S. J., & Nemeroff, C. B. (1997).
Neurotransmitter receptor and transporter binding profile of antidepressants and
their metabolites. The Journal of Pharmacology and Experimental Therapeutics,
283(3), 1305-1322.
12. Painter MM, Buerkley MA, Julius ML, Vajda AM, Norris DO, Barber LB. 2009.
Antidepressants at environmentally relevant concentrations affect predator
avoidance behavior of larval fathead minnows (Pimephales promelas).
Environmental Toxicology and Chemistry 28: 2677-2684.
13. Schultz, M. M., Painter, M. M., Bartell, S. E., Logue, A., Furlong, E. T., Werner,
S. L., & Schoenfuss, H. L. (2011). Selective uptake and biological consequences
of environmentally relevant antidepressant pharmaceutical exposures on male
fathead minnows. Aquatic Toxicology,
14. Du, B., Haddad, S. P., Luek, A., Scott, W. C., Saari, G. N., Kristofco, L. A., . &
Brooks, B. W. (2014). Bioaccumulation and trophic dilution of human
pharmaceuticals across trophic positions of an effluent-dependent wadeable
stream. Philosophical Transactions of the Royal Society B: Biological Sciences,
369(1656), 20140058.
15. Valenti Jr, T. W., Gould, G. G., Berninger, J. P., Connors, K. A., Keele, N. B.,
Prosser, K. N., & Brooks, B. W. (2012). Human therapeutic plasma levels of the
selective serotonin reuptake inhibitor (SSRI) sertraline decrease serotonin
reuptake transporter binding and shelter-seeking behavior in adult male fathead
minnows. Environmental Science & Technology, 46(4), 2427-2435.
16. Kellner, M., Porseryd, T., Porsch-Hällström, I., Hansen, S. H., & Olsén, K. H.
(2015). Environmentally relevant concentrations of citalopram partially inhibit
feeding in the three-spine stickleback (Gasterosteus aculeatus). Aquatic
Toxicology, 158, 165-170.
17. Weinberger II, J., & Klaper, R. (2014). Environmental concentrations of the
selective serotonin reuptake inhibitor fluoxetine impact specific behaviors
involved in reproduction, feeding and predator avoidance in the fish Pimephales
promelas (fathead minnow). Aquatic Toxicology, 151, 77-83.
18. Grabicova, K., Lindberg, R. H., Östman, M., Grabic, R., Randak, T., Larsson, D.
J., & Fick, J. (2014). Tissue-specific bioconcentration of antidepressants in fish
exposed to effluent from a municipal sewage treatment plant. Science of the Total
Environment, 488, 46-50.
19. Winberg, S., & Nilsson, G. E. (1993). Roles of brain monoamine
neurotransmitters in agonistic behaviour and stress reactions, with particular
reference to fish. Comparative Biochemistry and Physiology Part C:
Pharmacology, Toxicology and Endocrinology, 106(3), 597-614.
20. Mennigen, J. A., Stroud, P., Zamora, J. M., Moon, T. W., & Trudeau, V. L.
(2011). Pharmaceuticals as neuroendocrine disruptors: Lessons learned from fish
on prozac. Journal of Toxicology and Environmental Health, Part B, 14(5-7),
21. Brodin, T., Piovano, S., Fick, J., Klaminder, J., Heynen, M., & Jonsson, M.
(2014). Ecological effects of pharmaceuticals in aquatic systems—impacts
through behavioural alterations. Philosophical Transactions of the Royal Society
B: Biological Sciences, 369(1656), 20130580
CHAPTER SIX
CONCLUSIONS
For my first objective, I determined the effects of bupropion, a norepinephrine
and dopamine reuptake inhibitor (NDRI) antidepressant, on hybrid striped bass brain
chemistry and predatory behavior. I concluded that alteration of the brain dopaminergic
pathway does not affect predatory behavior in the HSB. This conclusion provided insight
to focus on SSRI antidepressants in future studies, since previous adverse effects were
observed using the same bioassay when HSB were exposed to serotonin targeting
antidepressants.
My next objective was to identify the target of SSRI antidepressants, the serotonin
reuptake transporter, in the hybrid striped bass and quantify the binding affinity of
various antidepressants to the serotonin reuptake transporter in the hybrid striped bass
brain. I concluded that the target of SSRI antidepressants, the SERT, is present in the
hybrid striped bass and the functional domains of this protein are highly conserved
among vertebrate species. I also found that the antidepressant binding affinities for the
HSB SERT were not as potent as binding affinity values reported for the human and rat
I next quantified the bioavailability of fluoxetine and venlafaxine, two previously
studied antidepressants that have caused adverse effects on brain chemistry and behavior,
through plasma and brain antidepressant concentrations. The partitioning trends of each
antidepressant differed and can be partially explained by the log Kow values for each
drug. Antidepressants quickly partition from the water into the plasma of the HSB,
within 6 hours of exposure, and some antidepressants reach the brain within that time
frame. Further, the internal dose, as measured by the brain antidepressants concentration,
was strongly correlated with decreases in brain serotonin levels and increases in time to
Lastly, I determined the effects of an environmentally relevant SSRI mixture on
hybrid striped bass brain chemistry and predatory behavior. The SSRI mixture study
resulted in mainly additive and a greater than additive change in brain serotonin,
determined by the dose equivalent approach. Further, antidepressants can remain
in the HSB brain and exert effects on brain chemistry and predatory behavior after
aqueous exposure has ceased, raising concerns about pulsed exposures to these
drugs in the environment.
Overall, the results of this work provide further evidence that antidepressant
alteration of brain serotonin concentrations in the HSB may be one of the controlling
neurotransmitters of predatory behavior in the HSB. The target of serotonin targeting
antidepressants is present in the hybrid striped bass and antidepressants are binding to
this receptor in the HSB brain. Therefore, pulsed releases of wastewater treatment plant
effluent into a receiving stream may contain around 4 μg/L total antidepressants
(determined from reported literature values of antidepressants in effluent dominated
streams). There are other factors in the environment that may reduce the bioavailability
such as increased natural organic matter and sediment that were absent from my
experiments. However, during summer months streams can be composed of 90% effluent
and the effluent pH values can vary from 6-9, affecting the ionization state and
partitioning of antidepressants into fish tissues. The fact that these antidepressants can
concentrate in the brain within 6 hours of exposure and remain in the brain for 6 days
after being in clean water, suggesting a fish may not completely depurate the
antidepressants before being exposed again. The lowest concentration of the SSRI
mixture had a total SSRI concentration of 2 μg/L, half of the predicted highest
environmental concentration, and resulted in evidence of greater than additive effects in
changes in brain serotonin levels and adverse effects on predatory behavior in the HSB.
Given the variety of processes and behaviors serotonin is involved with in fish, the
significant effects on brain serotonin in the HSB by the SSRI mixture raise ecological
concern for the complex mixtures of SSRIs in the aquatic environment.
Future studies should focus on individual exposures to sertraline and citalopram
using my same experimental design to elucidate if the additive or greater than additive
conclusions are occurring. Also, utilizing the identified SERT sequence in my studies, a
transfected cell line expressing the HSB SERT transporter would be a useful way to
identify the binding affinity of antidepressants to the SERT in a cleaner system, as well to
identify the functionality of the transporter. The HSB SERT sequence would also be
useful in examining SERT expression in brain and stomach samples throughout a 12-d
exposure. Further, the results of my dissertation along with two previous students' work
on antidepressants on HSB brain chemistry and predatory behavior has created a large
dataset. The development of a model using all of this data to make predictions of the
effects of SSRIs would be beneficial for ecological risk assessment.
Source: http://tigerprints.clemson.edu/cgi/viewcontent.cgi?article=2531&context=all_dissertations
Molecular Physiology of Urate Transport Matthias A. Hediger, Richard J Johnson, Hiroki Miyazaki and Hitoshi Endou 20:125-133, 2005. ; Physiology doi: 10.1152/physiol.00039.2004 You might find this additional info useful. 56 articles, 26 of which you can access for free at: This article cites This article has been cited by 29 other HighWire-hosted articles:
Safety Data Sheet Timbertreat™ A Azole Insecticide/Fungicide Wood Preservative RTU 1. IDENTIFICATION Product Name: Timbertreat™ A Azole Insecticide/Fungicide Wood Preservative RTU Other Names: Water based azole treating solution including penetration tracer, stabilizer and mouldicide.

