Microsoft word - shahab ijicsv9.doc
INTERNATIONAL JOURNAL OF INTELLIGENT CONTROL AND SYSTEMS
VOL. 14, NO. 1, MARCH 2009, 33-40
Understanding the Role of Liver Zonation in Toxin Elimination
Shahab SHEIKH-BAHAEI, Sean H. J. KIM, Shahriar SHEIKHBAHAEI and C. Anthony HUNT
Abstract- Using game theory and reinforcement learning, we
responsible for eliminating toxins and xenobiotics (includ-
created and analyzed generalized agent-based and compartmental
ing drugs) that find their way into blood. The rate of eli-
models of hepatic toxin elimination processes to explore plausible
mination, known as
causes of hepatic functional zonation. We considered a general situa-
hepatic clearance, is different for each
tion in which a group of protective agents (analogous to liver cells)
compound. Histologically, the liver is divided into lobules.
cooperate and self-organize their efforts to minimize optimally the
Lobules consist of hepatocytes arranged in a roughly cy-
negative effects of toxin intrusions. Following a totally different ap-
lindrical or spherical shape. The central vein (CV),
proach, we constructed a physiologically based model of a two-zoned
through which blood exits, is at the center. At the peri-
liver to study the physiological consequences of zonation. The results
of the two models support the hypothesis that liver zonation might be
phery are portal vein (PV) triads. A lobule is often de-
a consequence of an optimal strategy for toxin clearance.
scribed as being organized into three zones: periportal (up-
stream or zone 1), which encircles the portal tracts where
Index Terms—liver zonation, multi-agent learning, computa-
blood enters, middle (zone 2), and perivenous (downstream
tional biology, self-organizing, Q-learning, game theory
or zone 3), which is poorly oxygenated and located around central vein. Oxygenated blood enters upstream, passes
1. INTRODUCTION
through the mid-zone, and exits downstream. Because of
this spatial topology, different liver cells may not have the
The liver performs a wide range of functions including de-
toxification of blood-borne compounds. So doing protects
same exposure to incoming resources and compounds. For
the body. A human cannot live more than 24 hours with-
example, nutrients (e.g. oxygen) are more available to up-
out the liver. Hepatocytes, the parenchymal cells of the stream than to the downstream cells.
liver, are among the most complex cells in the body. They
Hepatocytes, although genetically identical, exhibit he-
cooperate with each other to detoxify xenobiotics by meta-
terogeneous enzyme and transporter activities depending
bolizing them to less toxic compounds. Over the course of
on their location within the lobule. For example, under
their evolution they have learned to do so in an effective
and optimal way. Hepatocytes express heterogeneous, lo-
normal conditions, hepatocytes located downstream ex-
cation-dependent enzyme and transporter activities to faci-
press more enzymes for xenobiotic metabolism than do up-
litate detoxification, apparently following an intrinsic stream hepatocytes. An obvious question is: why?
agenda, the principles of which are not fully understood.
This phenomenon is known as liver zonation [1]. To gain
insight into those processes, we constructed and analyzed a
generalized problem of cooperative agents protecting their
common wealth from harmful intruders. The agents are as-
sumed to have incomplete information about each other
and cannot form coalitions).
1.1 Biology Background
The liver is a complex biochemical factory which syn-
thesizes, modifies, and metabolizes thousands of sub-stances daily and provides the body with essential sub-
stances such as proteins and fats. The liver is also
Manuscript received April 1, 2009. This work was
supported in part by the CDH Research Foundation and a Graduate Fellowship to S. H. J.
Kim from the International Foundation for Ethical Research. This pa-
per is extended from "Multi-Agent Based Modeling of Liver Detoxifi-
Fig 1. Cross section of a liver lobule. PV: portal triads, CV: central vein,
cation" published at
Spring Simulation Multiconference 2009, Agent-
arrows: direction of blood flow. Oxygenated blood enters the lobule from
Directed Simulation Symposium, San Diego, CA, USA, March, 2009.
portal veins, and exits from central vein. Usually a liver lobule is de-
Shahab Sheikh-Bahaei (e-mail:
[email protected]) and S. H.
scribed as being divided into three functional zones.
J. Kim (e-mail:
[email protected]) are with the UCSF/UC Berke-
ley Joint Graduate Group in Bioengineering, University of California, Berkeley, CA 94720, USA. Shahriar Sheikhbahaei (e-mail: sha-
To represent hepatic metabolic zonation in physiologi-
[email protected]) is with Department of Molecular and Cell Biolo-
cally based, pharmacokinetic models, researchers [2][3]
gy, University of California, Berkeley, CA 94720, USA
usually divide the liver into compartments, each
C. A. Hunt is with Department of Bioengineering and Therapeutic
representing a different intrahepatic zone. Using a differ-
Sciences, University of California, San Francisco, CA 94143, USA (e-mail:
[email protected]).
ent approach, Lamers et al. [4] presents a "mechanistic
34 INTERNATIONAL JOURNAL OF INTELLIGENT CONTROL AND SYSTEMS, VOL. 14, NO. 1, MARCH 2009
model" which proposes that zonation is induced by porto-
ADC = e2·D = (1 – maxE2·p2)·e1·D
central signal gradients.
Expected average costs of resource consumption are:
2. METHODS
ARC1 = maxE1·p1·R
ARC2 = maxE2·p2·e1·R
All existing models of liver zonation are top-down
models. They fail to hypothesize elementary mechanisms Total expected costs are: that motivate the collective behaviors of liver cells.
<Cost1> = ARC1 + ADC = maxE1·p1·R +
(1 – maxE2·p2)(1 – maxE1·p1)·D
(-D, . -D)
<Cost2> = ARC2 + ADC = maxE2·p2·(1 – maxE1·p1)·R +
(1 – maxE2·p2)(1 – maxE1·p1)·D
(-R, 0,.0) (0,-R, 0,.0)
(0, 0,. -R)
Fig 2. The game-theoretic model of the system. Agents either ignore or
1> = maxE1·p1·(R – D) +
eliminate intruders. If Agent
i (Ai) eliminates an intruder, it pays the cost
{1 – maxE2·p2·(1 – maxE1·p1)}·D
of resource consumption (
R). If all agents ignore an intruder, all must pay cost
D, which is a consequence of damage caused by the intruder to the
<Cost2> = maxE2·p2·(1 – maxE1·p1)(R – D) +
common wealth.
p is the elimination strategy of agent i: it is the proba-
bility that Ai eliminates an incoming intruder. Ai's ability to eliminate is
(1 – maxE1·p1)·D
limited by
maxE
i (0 ≤
maxEi 1).
At any given location in the strategy space, agents have a
To understand the costs and benefits that may be asso-
preferred direction of movement to reduce their costs. For
ciated with liver zonation, we began by using the game the two-player game, the direction can be described as a theoretic model as shown in Fig. 2: a sequence of
vector field based on the gradients of the above two cost
is protecting their common wealth (all extrahepatic tissues)
against intruders. Agents are limited in their ability to
∂ <
Cost >
∂ <
Cost >
eliminate intruders. The goal of each is to minimize poten-
tial damage caused by the intruders while minimizing re-
source consumption. What is the optimal elimination The vector field is shown in Fig. 3 for
n = 3 and
D/
R = 0.6,
strategy for agent
i? Obviously, an optimal strategy for 1.1, 1.7, 2.3, 3.7 and 10.0. It is easy to find the equilibrium
agent
i depends on the strategies of other agents who have
of each game by inspecting its vector field. The figure
shows that the equilibrium changes as
D/
R increases.
Each agent has two options: eliminate or ignore an in-
When damage is very small (
D/
R < 1), all agents ignore
truder. The immediate cost for elimination is resource because it is not cost effective to eliminate intruders.
consumption, denoted by R. Ignoring an intruder does not
When damage is moderate, only downstream agents ex-
constitute an immediate cost; however, when all agents ig-
pend elimination effort. When damage is large, middle
nore an intruder (or it escapes for whatever reason), then agents cooperate with the downstream agents. When dam-
all must pay the cost associated with any damage caused to
age is large enough, all agents expend elimination effort.
the common wealth (denoted by
D). It is assumed that a
The analysis can be extended to a general case of
n
signal informs agents of the damage cost at the end of each
players as follows:
round of play. Agent
i cannot eliminate more than
maxE i
fraction of incoming intruders even if it expends maximum
ei = (1 – maxEi·pi)·ei-1 i = 1, 2, … , n eo = 1
elimination effort
(0 ≤
maxEi ≤
1). The elimination strate-
n·D
i,
p , is the probability that it eliminates an in-
coming intruder. Agents who see intruders earlier, are
ARCi = ei-1·maxEi·pi·R
called upstream agents; the others are called downstream
i> = ARCi + ADC
To analyze the game's equilibrium, we first specified
<Costi> = ei-1·maxEi·pi·R + en·D (Eq.3)
that there are only two agents. Their cost functions are where
e is the fraction intruders that escape from agent
i;
calculated as follows:
ADC is the average damage cost to each agent;
ARC is the
average cost of resource consumption to agent
i; and
1 = 1 – maxE1·p1
<Costi> is the total expected cost (due to both actions) to
e2 = (1 – maxE2·p2)·e1
agent
i. The vector field can be calculated the same as for
where
e and are the fraction of intruders that escape the two-player game, but it is infeasible to visualize and
from Agents 1 and 2. Expected average costs of damage to
find equilibria. In general, analyzing equilibria of games
each agent will be:
involving three or more players is hard [5][6].
Sheikh-Bahael et al: Understanding the Role of Liver Zonation in Toxin Elimination 35
The above analysis requires that all agents have a priori
ples and [10] for a review of other multi-agent learning
knowledge about other agents and the environment. All techniques). the actions available to other agents and all costs with all
Q-learning is a primitive form of learning [7] in which
combinations of actions are known by all agents. Conse-
utility values (
Q values) are learned for state-action pairs,
quently, it does not offer a mechanism through which au-
absent a model of the environment. It provides a simple
tonomous agents can reach an optimal strategy.
means for agents to learn how to act optimally in an un-
We considered a more realistic situation in which known environment. At each step, a
Q-learning agent uses
agents do not have a priori information about their envi-
its new experience to improve its long-term reward esti-
ronment (including other agents). We used multi-agent mate by combining new information with prior experience. simulation and enabled agents to learn from experience fol-
Each
Q-learning strategy is determined by the value
lowing a simple reinforcement learning rule. By keeping function,
Q, which estimates long-term discounted rewards track of accumulated reward (and penalty), agents could be
for each action. General scheme of
Q-learning algorithm
reinforced to learn an optimal clearance strategy. Their used by each agent is as follows: task was to maximize the long-term average reward per ac-tion.
(1) Observe the current state (in this study, there is only
Q-learning algorithm [7], a well known rein-
forcement learning algorithm, has been shown to converge
(2) Choose and execute an action based on the
Q-values
(available actions are
to an optimal decision policy.
from a set of available actions,
Act
Q-learning has a solid foun-
= eliminate and
= ignore). The agent selects its
dation in the theory of Markov decision processes [8]. It is
easy to implement and has been used widely in both single-
action according to a probability given by the Boltzmann distribution:
agent and multi-agent contexts (see [8] and [9] for exam-
D/
R = 0.6
D/
R = 1.1
D/
R = 1.7
D/
R = 2.3
D/
R = 3.7
D/
R = 10.0
Fig 3. At any given non-equilibrium point in the strategy space, the agents have a preferred direction of moving in order to decrease their expected costs. The net direction towards which one moves in the strategy space depends on the slope of the cost functions at that point. Cone arrows show the net direction of movement when
n = 3 and
D/
R ratio changes from 0.6 to 10.0. Each game's equilibrium is shown by a star. (A)
D/
R is small. In this case, all agents ignore the intruders. (B, C, D)
D/
R is moderately large; the equilibrium is such that Agent 1 ignores (
p = 0) but Agent 2 and 3 eliminate.
(E, F) When
D/
R is large enough, Agent 1 starts making elimination effort.
36 INTERNATIONAL JOURNAL OF INTELLIGENT CONTROL AND SYSTEMS, VOL. 14, NO. 1, MARCH 2009
and Km is the Michaelis-Menten constant. V
Q(
Act ) /
T
to be affected by the level of metabolic enzymes and trans-
∑
Q(
Act )/
T
porters expressed by cells. As a result each zone has its
max. The two zones are specified to have equal Km
T, called "temperature," adjusts the randomness of
(3) Observe the new state (for this study, this step is not
necessary because there is only one state) and receive an
immediate reward.
Q value based on the action taken,
a, using Eq.
Q a) ← 1
( −α)
Q(
a) +α(
reward + β
V )
V = max
Q(
b)
where α is the learning rate (0 ≤ α
< 1) and β is the dis-
counting factor (0 ≤ β
< 1). Here we specified
α
= 0.1
and
= 0.5.
V is known as the value of the game and is equal
to the maximum
Q value.
Figure 4. A physiologically-based model to analyze the effects of hepatic
2.1. The Agent-Based Model
zonation on toxicity exposure to the whole body. Boxes are reservoir compartments. Arrows show xenobiotic flow directions. q's are xenobiotic
In mammalian livers, an absorbed toxin can be cleared
flow rate constants. Xi's are xenobiotic concentration in corresponding re-
by any of a sequence of hepatocytes. In order to gain in-
servoir compartment shown. pi is the probability that xenobiotic passes
sight into that process, we modeled the liver as consisting through path i.
of many, parallel sets of toxin eliminating agents arranged
Further, we represent the cost to the organism, J, as be-
in sequence from PV to CV in Fig. 1. Each agent used a
ing proportional to (CL
Q-learning algorithm to decide its clearance strategy. An
1)2 + (CL2)2 + (cAUBC)2, where
agents' task was to minimize the extrahepatic damage to
1 and CL2 are intrinsic periportal clearance and intrinsic
perivenous clearance, respectively; AUBC is the area un-
the organism of which they are part. We specified that der the blood concentration curve and c adjusts the relative
agents become aware of extrahepatic tissue damage via cost contribution of a fixed dose based on xenobiotic toxic-
alarm signals that are quickly released into blood by the ity.
damaged tissue. Doing so was based on the fact that hepa-tocytes, like immune cells, express toll-like receptors [15].
They enable cells to detect chemical alarm signals generat-
3. RESULTS
ed by damaged tissues.
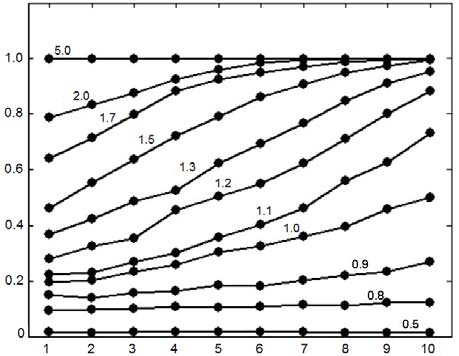
Figure 5 shows the emergent strategies obtained for
2.2 Physiologically-Based Model
different values of
D/
R. When
D/
R is small, agents expend
In addition to the agent-based model, we used a tradi-
little effort to eliminate intruders. As
D/
R increases,
tional physiologically-based modeling approach to study downstream agents expend more elimination effort than the effects of hepatic zonation on toxicity exposure to the upstream agents. When
D/
R is large, upstream agents be-whole body (Fig. 4). For simplicity, the liver is gin cooperating and contribute to the elimination process, represented as having two zones: periportal (zone 1) and until all agents are expending maximum effort. Although perivenous (zone 2). Compounds in the liver are assumed the downstream agents always expend an equal or greater to stochastically take one of the following four paths with
effort than do upstream agents, it does not mean that
probability pi: Path 1: neither of the two zones encounters downstream agents actually eliminate more intruders. For
the compound. Path 2: only zone 1 encounters the com-
example, when
D/
R = 5.0, upstream agents eliminate more
pound. Path 3: both zones encounter the compound. Path 4:
intruders than do downstream agents.
only zone 2 encounters the compound.
Figure 6 shows the results from the physiologically
There is one set of differential equations for each path
based model. Figure 6A shows a typical 3D surface of the
(Table A1). At each time step, one of the four sets is cho-
cost function, J, when c = 0.1. At that toxicity value, the
sen according to the probability associated with the corres-
minimum cost (Jmin) occurs when CL1 = 0.35 and CL2 =
ponding path. In this model, zone 1 and zone 2 eliminate 0.45 (i.e. zone 2 expends more clearance effort than zone compounds independent of each other. We specify that the
1). What happens if toxicity is altered? Figure 6B shows
mechanisms of xenobiotic elimination in the liver (includ-
how Jmin changes if toxicity varies from 0.05 to 5. It depicts
ing uptake transport, biliary efflux and metabolism) follow
as toxicity increases, both CL1 and CL2 increase however
saturable Michaelis-Menten kinetics. Intrinsic clearance of
2 is greater or equal to CL1 at all toxicity levels. That
observation is consistent with the game theoretic and mul-
each zone is specified to be CLi = Vmax,i/Km, where Vmax ti-agent models results.
is the maximum elimination (metabolic + transport) rate
Sheikh-Bahael et al: Understanding the Role of Liver Zonation in Toxin Elimination 37
communication mechanisms provide appropriate danger signals to agents, informing them about damage caused. Furthermore, agents are assumed to take and use the best
Fig 5. Equilibrium of the n-player game changes with D. Upstream is to the left (small numbers) and downstream is to the right. The average eli-mination strategies of 10 agents are shown for different ratios of D/R (shown on each curve) after 10,000 simulation steps (maxE = 0.05).
When D/R is small, upstream and downstream agents expend little elimi-
nation effort. As D/R ratio increases, downstream agents expend more elimination effort than upstream agents. When D/R is large, upstream agents start to cooperate and contribute to the elimination process.
4. VALIDATION
Liver cells exhibit a similar behavior: they express he-
terogeneous, location-dependent enzyme and transporter activities to detoxify compounds. Downstream cells com-mit most to toxin elimination; in other words, xenobiotic metabolism is preferentially located downstream, in the pe-rivenous region [1]. The model also suggests that the loca-tion of hepatotoxicity depends on compound toxicity: less toxic compounds are likely to damage the downstream re-gion, whereas compounds that are more toxic are more Fig 6. Effects of toxicity change in the physiologically-based model. (A) likely to damage the upstream region. Several highly toxic
3D plot of cost function, J, versus CL1 and CL2, when c = 0.1. (B) Dotted
compounds [11], such as TCDD (LD50 = 0.034 mg/kg), curve: trajectory of Jmin as c changes from 0.05 to 0.5. For each point on
the trajectory the value of corresponding c is reported. Solid line: the uni-
cyclochlorotine (LD50 = 2-3 mg/kg), and gossypol (LD50
= 5 mg/kg), selectively damage the upstream zone [12-14].
On the other hand, less toxic compounds such as acetami-
Simulations showed that agents adjust their clearance
nophen (LD50 = 1295 mg/kg) selectively damage the effort based on the following two factors: the potential
downstream zone [11].
damage caused by intruders, and their ranked proximity to
the entity being protected. Downstream agents (the ones
5. DISCUSSION
with less proximity to the common wealth) generally ex-
pend more elimination effort than do upstream agents, de-
We presented a simple, agent-based model of a genera-
pending on the threat.
lized, hepatic xenobiotic clearance process. The model
The emergent, collective behaviors of these agents are
consists of a group of agents that, similar to hepatocytes, similar to those of hepatic cells in terms of xenobiotic cooperate to protect a common wealth against toxic intrud-
clearance. The model suggests that an underlying mechan-
ers. The agents do not have a priori information about ei-
ism responsible for liver zonation may be similar to the
ther the environment or other agents (e.g., the number of model's simple mechanism. Hepatocytes may possess other agents, actions available to them, costs associated subsystems (e.g. special proteins, signaling pathways, etc.) with their actions, etc.). The agents use Q-learning, a pri-
that produce phenomena that have properties that are indis-
mitive form of learning, to minimize their long-term dis-
tinguishable from those of the Q-learning algorithm.
counted costs. Agents are assumed to know the cost of
Can hepatocytes learn? At the molecular level, short-
their own actions. We also assume that relatively fast term memory (persistent for weeks) within brain forms in

38 INTERNATIONAL JOURNAL OF INTELLIGENT CONTROL AND SYSTEMS, VOL. 14, NO. 1, MARCH 2009
part by changing the strength of existing synaptic contacts.
[13] T. Tatsuno, E. Ito and K. Terao, "Liver injuries induced by cycloch-
It can be achieved by altering the amount of neurotransmit-
lorotine isolated from Penicillium islandicum." Arch. Toxicol., vol. 55, pp. 39-46, 1984.
ter released from presynaptic terminals and/or postsynaptic
[14] Y. C. Lin, D. C. Nuber and S. Manabe, "Zone-specific hepatotoxicity
receptor concentrations [17]. Simply stated, the molecular
of gossypol in perfused rat liver." Toxicon, vol. 29, pp. 787-90,
mechanism of learning involves adaptation of synaptic
strength based on feedback signals received from other [15] T. R. Billiar, Y. Vodovotz, D. A. Geller, A. N. Salyapongse and S.
Liu, "Hepatocyte toll-like receptor 2 expression in vivo and in vi-
neurons [18]. Hepatocytes exhibit complex behavior. Re-
tro: role of cytokines in induction of rat TLR2 gene expression by
cent studies show that toxin-induced hepatocyte injury is
lipopolysaccharide." Shock, vol. 14, pp. 361-5, 2000.
not a simple passive process regulated by the dose of an [16] M. Hosseini-Yeganeh and A. J. McLachlan, "Physiologically Based inducer compound; rather it is an active process in which
Pharmacokinetic Model for Terbinafine in Rats and Humans," An-timicrob. Agents Chemother., vol. 46, pp. 2219, 2002.
active signaling plays a crucial role [19]. Hepatocytes [17] E. R. Kandel and J. H. Schwartz, "Molecular biology of learning:
change protein expression levels in response to toxic
modulation of transmitter release," Science, vol. 218, pp. 433-443,
shocks [1] and adjust their sensitivity to signaling mole-
cules (for example see [20] and [21]). Upstream hepato-
[18] E. R. Kandel, J. H. Schwartz and T. M. Jessell, Essentials of Neural
Science and Behavior. Appleton & Lange, 1995,
cytes can communicate with downstream hepatocytes via [19] B. E. Jones and M. J. Czaja, "Intracellular signaling in response to
blood borne signals [4] and/or intercellular calcium waves
toxic liver injury," Am. J. Physiol. Gastrointest. Liver Physiol., vol.
[22-23]. On the other hand, downstream cells can commu-
275, pp. 874-878, 1998.
nicate back with upstream cells via bile acids [24]. This bi-
[20] Y. Xu, B. E. Jones, D. S. Neufeld and M. J. Czaja, "Glutathione
modulates rat and mouse hepatocyte sensitivity to tumor necrosis
directional communication creates a complex intercellular
factor α toxicity," Gastroenterology, vol. 115, pp. 1229-1237,
feedback system which might contribute to regulation of
adaptation (learning) in the liver.
[21] S. Herrmann, M. Seidelin, H. C. Bisgaard and O. Vang, "Indolo [3,
2-b] carbazole inhibits gap junctional intercellular communication in rat primary hepatocytes and acts as a potential tumor promoter,"
Carcinogenesis, vol. 23, pp. 1861, 2002.
We thank Prof. Yoav Shoham and members of the [22] G. DUPONT, T. TORDJMANN, C. CLAIR, S. SWILLENS, M.
CLARET and L. COMBETTES, "Mechanism of receptor-oriented
UCSF BioSystems Group for helpful suggestions and dis-
intercellular calcium wave propagation in hepatocytes," FASEB J.,
cussions. We gratefully acknowledge research funding
vol. 14, pp. 279-289, 2000.
provided by the CDH Research Foundation and a Graduate
[23] V. Serrière, B. Berthon, S. BOUCHERIE, E. Jacquemin, G. Guillon,
Fellowship (SHJK) from the International Foundation for
M. Claret and T. Tordjmann, "Vasopressin receptor distribution in the liver controls calcium wave propagation and bile flow 1," FA-
Ethical Research.
SEB J., vol. 15, pp. 1484-1486, 2001.
REFERENCES
[24] R. Gebhardt and F. Gaunitz, "Cell-cell interactions in the regulation
of the expression of hepatic enzymes," Cell Biol. Toxicol., vol. 13,
[1] K. Jungermann, "Zonation of metabolism and gene expression in liv-
pp. 263-273, 1997.
er." Histochem. Cell Biol., vol. 103, pp. 81-91, 1995.
[2] T. N. Abu-Zahra and K. S. Pang, "Effect of Zonal Transport and Me-
tabolism on Hepatic Removal: Enalapril Hydrolysis in Zonal,
Shahab Sheikh-Bahaei received B.S. degree
Isolated Rat Hepatocytes In Vitro and Correlation with Perfu-
in Electrical Engineering in Dec. 1999 from
sion Data," Drug. Metab. Dispos., vol. 28, pp. 807-813, 2000.
Isfahan University of Technology, Isfahan,
[3] M. R. Gray and Y. K. Tam, "The series-compartment model for hepat-
Iran; and M.S. degree in Control Engineering
ic elimination," Drug Metab. Dispos., vol. 15, pp. 27-31, 1987.
in Dec. 2003 from University of New Mex-
[4] W. H. Lamers, T. Grange, A. F. Moorman, J. M. Ruijter, H. Sassi and
ico, Albuquerque, USA. He is currently a
V. M. Christoffels, "A mechanistic model for the development and
doctoral candidate in the UCSF/UC-Berkeley
maintenance of portocentral gradients in gene expression in the liv-
Joint Graduate Group in Bioengineering at University of Califor-
er." Hepatology, vol. 29, pp. 1180-92, 1999.
nia, San Francisco and Berkeley. His areas of interest include
[5] C. Daskalakis and C. H. Papadimitriou. (2005, Three-player games are
hard. Electron. Colloq. Comput. Complexity 139
modeling and simulation, multi-agent systems, self-organizing
[6] C. Daskalakis, P. W. Goldberg and C. H. Papadimitriou, "The com-
systems, complex systems modeling and artificial intelligence.
plexity of computing a nash equilibrium," in 2006, pp. 71-78.
[7] Watkins, Christopher J. C. H. and P. Dayan, "Technical Note: Q-
Sean H. J. Kim received B.A. degree in computer science and
Learning," Mach. Learn., vol. 8, pp. 279-292, 1992.
mathematics in 2001 from University of California, Berkeley,
[8] J. Hu and M. P. Wellman, "Nash q-learning for general-sum stochastic
USA. He is currently a doctoral student in the UCSF/UC Berke-
games," Journal of Machine Learning Research, vol. 4, pp. 1039-
ley Joint Graduate Group in Bioengineering at University of Cali-
fornia, San Francisco and Berkeley. His research interests in-
[9] E. Yang and D. Gu, "Multiagent Reinforcement Learning for Multi-
Robot Systems: A Survey." 2004.
clude multi-agent, discrete event-oriented modeling and
[10] Y. Shoham, R. Powers and T. Grenager, "If multi-agent learning is
simulation, systems biology, theoretical formalisms for biology,
the answer, what is the question?" Artificial Intelligence, vol. 171,
and computational methods in drug development. His technical
pp. 365-377, 2007.
knowledge draws from previous software engineering experience
[11] TOXNET US Nat'l Library of Medicine, 2008. at Cadence Design Systems and Avanti Corporation in the elec-
http://toxnet.nlm.nih.gov/. Accessed 05/2008
tronic design automation industry.
[12] L. S. Birnbaum, S. K. Alcasey, G. W. Lucier, K. O. Lindros, J. Blan-
ton, N. J. Walker, V. M. Richardson and M. J. Santostefano, "Dose-dependent localization of TCDD in isolated centrilobular
and periportal hepatocytes." Toxicol. Sci., vol. 52, pp. 9-19, 1999.


Sheikh-Bahael et al: Understanding the Role of Liver Zonation in Toxin Elimination 39
Shahriar Sheikhbahaei will receive B.A. de-
gree in molecular and cell biology with a con-
q42 x4
centration on neurobiology in 2009 from Uni-
versity of California, Berkeley, USA. His
V max 2 x3
q x1 q3 x3
current research is on plasticity of neuronal
synapses. His research interests include synap-
tic plasticity, cellular and molecular neurobi-
q3 x3
(q41 q42 q43 )x4
ology, developmental neurobiology, neurogenetics and mechan-
isms of nervous system structure and function.
q43 x4
q5 x5
C. Anthony Hunt received B.S. degrees in
Chemistry and Applied Biology from the Model Parameters. Volumes of distribution: The apparent
Georgia Institute of Technology and the Ph.D.
volume of distribution differs from compound to com-
degree from the University of Florida. His re-search transitioned from wet-lab to computa-
pound and from organ to organ. We assume that the model
tional in 1998. He directs the BioSystems compartments are well-stirred and substrates instantly dis-Group. The group's research focuses on de-
tribute in the entire tissue volume. The volumes of organs
veloping and using advanced modeling and are reported for a 250-g rat in Table A.2.
simulation methods to help unravel the complexities of biological
systems used in biomedical and pharmaceutical research. Dr.
Hunt is a member of several scientific and engineering societies,
1 = Volume of G.I Tract (Vgi
stomach + Vsmall intestine +
including ACM, IEEE Engineering in Medicine and Biology So-
ciety, Society for Computer Simulation International, and Bio-
2 = Volume of zone 1 (Vz1
medical Engineering Society. He is a member and fellow of the
) = (1/4) V
American Association for the Advancement of Science and the
3 = Volume of zone 2 (Vz2
American Association of Pharmaceutical Scientists.
V4 = Volume of blood (Vb)= Varterial blood
V5 = Volume of other organs = V(muscle + skin + adipose
Appendix
+ heart + kidney)
Table A1. Equations of the model for each of the
four paths shown in Figure 4.
Table A.2. Physiological parameters of tissues in a 250-g rat [16].
V (ml)
Q (ml/min)
q42 x4
q x1 (q42
q43 )x4
q5 x5
q42 x4
q = blood flow of G.I. Tract (Qgi)
=hepatic blood flow (QL)
V max1 x2
q x1 q3 x2
q =hepatic arterial flow (QL-Qgi)
q =G.I. Tract blood flow (Qgi)
q3 x2
(q41 q42 q43)x4
q =effective flow of substrates from blood to other organs
which we assume is generally less than the sum total blood
q43 x4
q5 x5
flow of the organs.
q5=clearance rate of xenobiotics from blood by other or-
q42 x4
gans which is primarily done by kidney (renal clearance).
The rate constants are listed in Table A3.
V max1 x2
q x1 q2 x2
V max 2 x3
q3 x 2 q3 x3
= q x − (q + q + q )x
If the liver lobule is roughly approximated as a cylinder (radius
r and height h) with two zones, then zone 2 (perivenous) could
q43 x4
q5 x5
be thought of as a smaller cylinder with radius r/2. The rest of
the volume would represent zone 1 (perportal). The ratio of the two volumes can be calculated as follows: Volume of zone 1 = Vz1 = 2hπr2-hπr2; Volume of zone 2 = Vz2 =
hπr2; Vz1/Vtotal= 3πr2/4πr2 = 3/4; and Vz2/Vtotal= πr2/4πr2 = 1/4
40 INTERNATIONAL JOURNAL OF INTELLIGENT CONTROL AND SYSTEMS, VOL. 14, NO. 1, MARCH 2009
Table A3. Rate constant values.
Parameter Value
Metabolic Enzymes (Vmax and Km): We assume that the mechanisms of xenobiotic elimination in the liver (includ-ing uptake transport, biliary efflux and metabolism) are sa-turable. We represent the mechanisms using Michaelis-Menten kinetics.
Source: http://www.ezconf.net/IJICS/files/152/3-Shahab_IJICS.pdf
Bioscience at a Crossroads Access and Benefit Sharing in a Time of Scientific, Technological and Industry Change:The Food and Beverage Sector Bioscience at a Crossroads: Access and Benefit Sharing in a Time of Scientific, Technological and Industry Change: The Food and Beverage Sector About the Author and Acknowledgements:Rachel Wynberg holds a Bio-economy Research Chair at the University of
2. La Plataforma de Afectados por la Hipoteca. De la Crisis a la Estafa. Del Prozac al Lluís Mangot Sala1 La Plataforma d'Afectats per la Hipoteca ha esdevingut el moviment més potent dels últims dos anys en termes d'impacte en les estructures polítiques i econòmiques, així com de presència als mitjans de comunicació de l'Estat. A partir d'una perspectiva que combina l'anàlisi estructural del context en què

