Gis.smumn.edu
Designing and Analyzing a Habitat Model of American Ginseng in the Southern United
States
Seth D. Webinger
Department of Resource Analysis, Saint Mary's University of Minnesota, Winona, MN,
55987
Keywords: American Ginseng, Habitat Model, Raster Analysis, Statistical Analysis,
Geographic Information Systems (GIS)
Abstract
American ginseng (
Panax quinquefolius L.) is a threatened plant harvested for its root, which
when dried, can sell for $125-$500 per pound domestically and $1500-$2000 per pound
internationally. Starting during the 2012 field season, resource management staff and law
enforcement officials at the research study area (omitted for data privacy) began proactive
efforts to help protect the plant and catch poachers within the study area's boundary. To aid
in the effort of locating potential ginseng growth sites, a habitat model was created consisting
of different habitat variables most favorable for ginseng growth and analyzed using point
data of known ginseng locations. Statistical analysis was used to examine the legitimacy and
usefulness of the model in being an effective tool.
Introduction
and all National Park Service lands
prohibit harvesting of wild ginseng while
American ginseng (
Panax quinquefolius
some US Forest Service lands will allow
L.) is a plant that grows in North
harvesting with a permit (USFWS, 2015).
American eastern deciduous forests,
Ginseng is intensively harvested
stretching from portions of southern
due to the high price at which its roots can
Canada to the Midwest, Southeast, and the
be sold. The price for ginseng roots varies
Northeast portions of the United States
from year to year but Anderson, Anderson,
(USDA, 2014). The American Ginseng
and Houseman (2002) acknowledge that
growth range in North America is
dry ginseng roots can sell from $125-$500
provided in Appendix A. Despite the vast
per pound domestically. More recently, the
coverage in which ginseng grows, the
State of Kentucky listed the price of dried
United States Department of Agriculture
ginseng roots in the range of $300-$350
lists the plant as threatened or endangered
per pound domestically and $1500-$2000
in Connecticut, Maine, Massachusetts,
per pound internationally (University of
Michigan, New Hampshire, New York,
Kentucky College of Agriculture, 2012).
North Carolina, Pennsylvania, Rhode
Nearly 95% of all ginseng roots harvested
Island, and Tennessee (USDA, 2014).
within the United States end up being sold
Nineteen States allow ginseng
to China (Snow and Snow, 2009).
harvest on private lands. Each state has its
Cultivated ginseng can be harvested at any
own regulations for sustainable
age, but Hu (1976) states prices of
management of the plant, but generally a
cultivated roots are generally much lower
plant five years old and with at least three
due reduced chemical potency.
leaves can be harvested. Most state lands Webinger, Seth. 2015. Designing and Analyzing a Habitat Model of American Ginseng in the Southern United States. Volume 17, Papers in Resource Analysis. 13 pp. Saint Mary's University of Minnesota Central Services Press. Winona, MN. Retrieved (date) from http://www.gis.smumn.edu
Because of the staggering price at
ginseng is being harvested is greater than
which ginseng can be sold, law
the number of wild plants being grown,
enforcement efforts have increased within
causing a decrease in the total population
some locations to combat poaching. At
of ginseng (McGraw
et al., 2010).
Great Smoky Mountains National Park
When considering the ecological
(GRSM), 13,000 plants were seized by
questions within a spatial context, "The
Park Rangers over an 18-year period
environmental education and research
leading up to 2011 (National Parks
potential for GIS applications is
Conservation Association, 2011). In 2012,
substantial" (Snow and Snow, 2009). This
resource management staff and law
research explores the question of whether
enforcement officials at this project's
or not historical ginseng data at the study
study area began taking proactive
area can successfully validate the creation
measures to try and reduce ginseng
of a custom-built ginseng habitat model.
poaching. The study area is combed for
ginseng plants and when found roots of
Ginseng Habitat
plants are exposed and marked with a
special dye and metal chip which are both
As with any flora, certain habitat
specific identifiers to the study area. This
characteristics must be present for ginseng
does not simply prevent plants from being
to grow. Soil type, elevation, slope, aspect,
extracted, it allows law enforcement
and canopy cover can all play a role in
officials to prove if plants came from the
achieving suitable growth. Each habitat
study area when they make contact with
variable can have a range of values
someone with ginseng roots in their
favorable for ginseng growth.
possession. Without dye and metal chips,
it can be very difficult for law enforcement
officials to make a case against an
individual suspected of poaching roots.
Nutrient-rich soils with a pH level greater
A report furnished by the US Fish
than 5.5 are most suitable for ginseng
and Wildlife Service in 2000 lists both
growth (Rock, Tietjen, and Choberka,
ginseng dealers and hunters confirming
1999). The University of Kentucky
that American Ginseng is increasingly
College of Agriculture (2012) adds that
more difficult to find (Anderson
et al.,
ginseng tends to grow in soils that are
2002). Over-harvesting of ginseng, or any
"moist, well-drained, and high in organic
plant, can "drive populations to
commercial and biological extinction"
(Van der Voort, Bailey, Samuel, and
McGraw, 2003). A study by McGraw,
Souther, and Lubbers (2010) discusses the
In a study (Rock
et al., 1999) conducted at
difficult recovery ginseng faces after an
GRSM, ginseng was found to grow at
intense harvest. They focused on two
lower elevations within the park, ranging
study areas intensely harvested, one in
from 2160-3620 feet. GRSM and the study
Missouri and one in West Virginia. After
area are both within the Appalachian
five years in Missouri and 11 years in
West Virginia, ginseng growth had yet to
reach the pre-harvest number of plants.
Findings suggest the number in which
According to Anderson
et al. (2002),
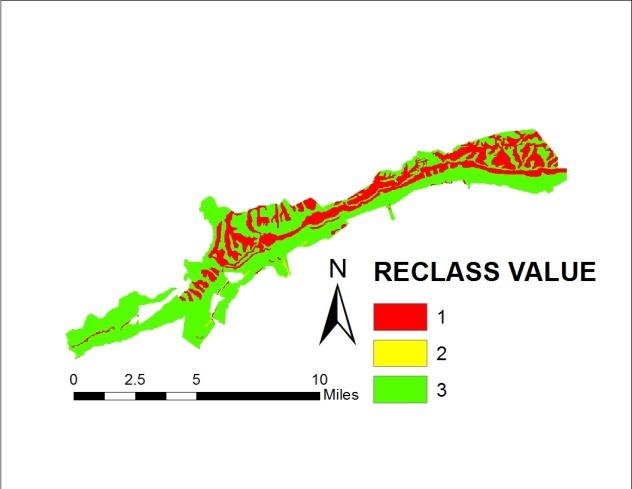
This study analyzed different
ginseng is usually found growing on
habitat variables to create a predictive
slopes that are 10-40% and as far up to
model to target areas containing habitat
60%. In the GRSM study, field
most suitable for ginseng growth. Desired
verification was performed at locations
habitat was the result of a weighted sum of
known to have ginseng and observed slope
five reclassified habitat layers. The
ranged from 8-36% with an average of
weighed sum's output was reclassified into
24.2% (Rock
et al., 1999).
three categories: least suitable for ginseng
growth, suitable for ginseng growth, and
most suitable for ginseng growth. Known
locations of ginseng plants were obtained
Ginseng can grow on any aspect but Snow
to validate the model.
and Snow (2009) determined north or east
orientation is best. Rock
et al. (1999)
found ginseng was typically found
growing on aspects to the north, ranging
To test the effectiveness of the model,
between 354° and 10°. In addition, if west
statistics were used to determine if the
facing slopes or slopes of any other
sample population of ginseng points came
orientation are covered by shade for part
from one of the suitability levels created
of the day, ginseng may grow there as well
by the weighted sum of habitat variables.
(Anderson
et al., 2002).
It would be best if sample ginseng points
came from the most suitable level of the
weighted sum. Therefore, the null
hypothesis (HO) and alternative hypothesis
Excessive amounts of sunlight, or even too
(HA) were stated as:
much shade, can be detrimental to the
lifespan of a ginseng plant. At GRSM,
HO: The sample of ginseng points
ginseng was found to grow underneath a
collected in the study area came from
canopy ranging from 20-70% with an
locations considered to be most
average canopy cover at 61.3% (Rock
et
suitable for ginseng growth according
al., 1999). The University of Kentucky
College of Agriculture (2012) suggests
HA: The sample of ginseng points
ideal canopy cover for ginseng growth is
collected in the study area came from
a combination of habitat suitability
levels created by the model.
Because ginseng is protected within the
study area and because of high prices in
Data Collection
which the plant's roots can be sold, the
protection of ginseng is an ongoing
A Digital Elevation Model (DEM) of the
process. The combined effort of searching
study area was created from the National
for ginseng, carefully exposing and
Elevation Dataset furnished by the United
marking plants roots and collecting GPS
States Geological Survey. Using the
data points is a tedious process requiring
Spatial Analyst within ArcGIS, Slope and
increased time and personnel.
Aspect raster datasets were derived from
the elevation data. Soils vector data was
cell. The higher the value assigned, the
collected using the Web Soil Survey tool
more likely ginseng could grow at that
from the United States Department of
particular location for each variable.
Agriculture, National Resource
The z-unit (altitude) for the
Conservation Service. Finally, canopy
elevation data was originally in meters and
cover vector data was collected from the
then converted to feet by multiplying the
LANDFIRE data site, a program created
dataset by 3.28083 using Spatial Analyst.
by the wildland fire management programs
Because ginseng was observed more
of the US Forest Service and Department
frequently at lower elevations at GRSM
(Rock et al., 1999), cells between 1111-
GPS waypoints of ginseng
1911 feet were assigned a value of 3, cells
locations were collected during ginseng
between 1911-2710 feet were assigned a
growing seasons from 2012-2014. One
value of 2, and cells between 2710-3509
waypoint did not specifically represent one
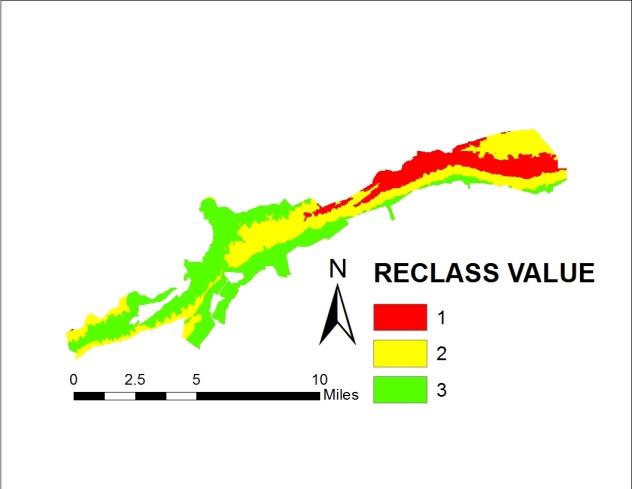
feet were assigned a value of 1 (Figure 1).
plant; in some instances a waypoint may
The greater the value assigned to a cell,
represent a cluster of plants within close
the more desirable the habitat
proximity of each other. In total, 940
characteristic is at that location.
waypoints were collected from 2012-2014
while 4597 ginseng roots were marked
during that same period. The ginseng
vector point data and study area boundary
vector data were provided by resource
management staff at the study area.
Data Analysis
It should be noted that spatial and textual
references to data and the study location
was purposely omitted from the paper and
Figures 1-5 due to the need to protect
sensitive locational data. For this same
Figure 1. Elevation: 1111-1911 feet (green), 1911-2710 feet (yellow), 2710-3509 feet (red).
reason, a map depicting actual ginseng
plant locations was also omitted from this
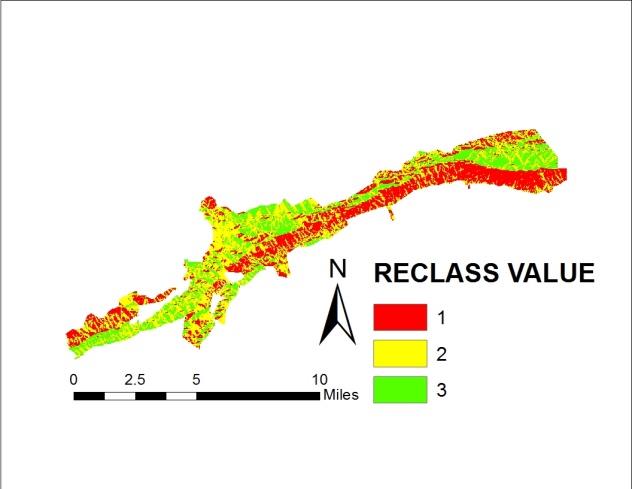
Aspect was consistent with north-
facing slopes best for ginseng growth,
while east and west slopes were suitable as
Raster Processing
well. South-facing slopes were not
recommended, but the possibility for
Each dataset was clipped to the study area
growth exists depending on slope position
and projected to the coordinate system
and shelter from sunlight (Anderson et al.,
UTM NAD 1983 Zone 17N. Habitat
2002). Therefore, north-facing slopes were
variables in vector format were converted
given a value of 3, east- and west-facing
to raster data. Cells for each raster dataset
slopes were given a value of 2, and south-
were set to 30 x 30 meters. Once all the
facing slopes were given a value of 1
data were in raster format, cells in each
habitat variable were reclassified
Average slope for each 30 x 30
according to attributes assigned to each
meter cell within the slope layer ranged
anywhere from 0% to 80%. Relying
College of Agriculture (2012),
heavily on the study conducted at GRSM
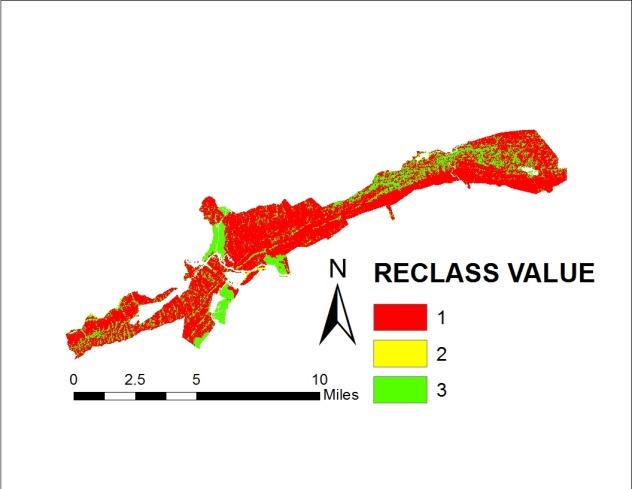
approximately 70-80% canopy cover is
and other literature (Anderson et al.,
needed for ginseng growth; the average
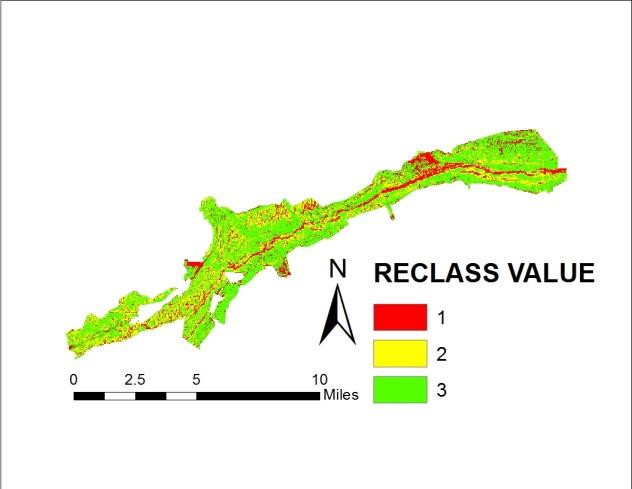
2002), slopes between 10-40% were
shade found at GRSM was 61.3%. For the
canopy layer, cells with cover between 50-80% were reclassified as 3, cells between 20-50% were reclassified as 2, and cells between 10-20% and between 80-100% were reclassified as 1 (Figure 4).
Figure 2. Aspect: North (green), East and West (yellow), South (red). Areas in green represent orientations most suitable for ginseng growth while areas in red represent orientations least suitable for ginseng growth.
assigned values of 3, slopes between 40-
Figure 4. Canopy Cover: 50-80% (green), 20-50% (yellow), 10-20% and 80-100% (red). A vast
60% were assigned values of 2, and slopes
majority of the study area contains canopy cover
between 0-10%, and 60% and greater were
least suitable for ginseng growth (red) while some
assigned values of 1 (Figure 3).
pockets of the study area contain suitable canopy
Ginseng requires a balance of
cover (yellow) and most suitable canopy cover
shade and sunlight to generate growth.
According to the University of Kentucky
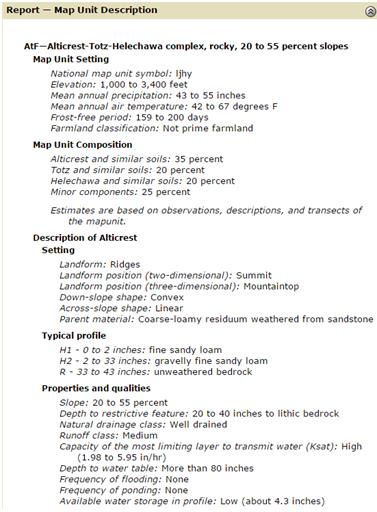
The drainage class for each soil
type was used to determine ideal conditions for ginseng growth. Well drained soils were given a value of 3, somewhat well drained soils were given a value of 2, and excessively drained soils, somewhat excessively drained soils, and poorly drained soils were given a value of 1 (Figure 5). An example of the map unit soil description report is provided in Appendix B.
Figure 3. Slope: 10-40% (green), 40-60% (yellow),
0-10% and 60% and greater (red). Suitable
With each habitat layer reclassified to
(yellow) and most suitable (green) slope for
represent the likelihood for ginseng
ginseng growth dominate the study area with some
growth, the weighted sum function in
least suitable slope (red) scattered throughout.
ArcGIS was used to combine the raster
datasets. Aspect, slope, canopy cover, and
Three separate shapefiles of ginseng points
soils layers were all given equal weight
were provided for each year from 2012-
and multiplied by a coefficient of .225.
2014. To start, each of the three point
shapefiles were merged together to create Table 1. Breakdown of acreage between ginseng habitat suitability levels for the study area.
Suitability Level
Figure 5. Soils: Well Drained (green), Somewhat
one master shapefile of all ginseng
Well Drained (yellow), Excessively Drained, Somewhat Excessively Drained, and Poorly
waypoints collected. ArcGIS was used to
Drained (red). The study area is practically split in
assign a suitability score from the cells of
half between most suitable soils for ginseng growth
the ginseng habitat suitability raster to
(green) and least suitable soils for ginseng growth
each ginseng waypoint by its location.
This value was appended to the ginseng
point attribute table.
Because literature only suggested ginseng
Because each ginseng waypoint
tends to grow at lower altitude, but failed
had a suitability score assigned to it,
to give specifics (Rock et al., 1999), the
further analysis was performed to see how
elevation layer was multiplied by a
many points fell into each suitability
coefficient of .1.
category. Eleven points were assigned a
A resulting dataset was created
value of -9999 meaning that the point fell
with each cell value between 0-3—the
outside of the area composed of the habitat
higher the cell value, the greater chance
ginseng suitability raster. This could be
for ginseng growth. This dataset was
due to the accuracy of the GPS signal
reclassified into three classes using the
during data collection which can include,
natural breaks (Jenks) method. The Jenks
but is not limited to, the number of GPS
natural breaks optimization method
satellites available, GPS receiver quality,
clusters data based on natural groupings.
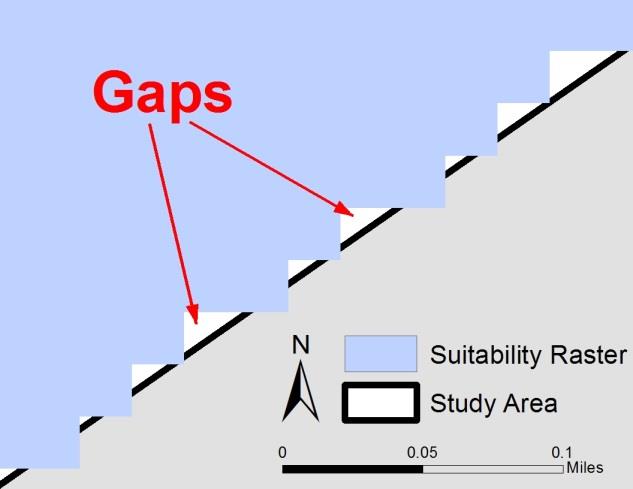
or user error. Cell size used in the analysis
Similar values are clustered into a group
could have also been a factor, potentially
while groups are divided based on the
leaving gaps along the study area's
largest gaps between values in the data
boundary (Figure 6). For this study, these
distribution. Due to the sensitive nature of
11 points were excluded from further
the results, a map of the output is restricted
from published results; however, a
breakdown of acreage between classes is
Statistical Analysis
provided in Table 1.
To determine the effectiveness of the
spatial model, parametric statistics were
used to compare the mean of ginseng
most suitable for ginseng growth) (Table
points to determine if it equaled the mean
of the cells from the most suitable habitat
It is assumed the variances of the
level. The mean of the ginseng points was
two populations are unequal because they
also compared to the mean of the least
come from two unrelated datasets. This
suitable habitat level and compared to the
was confirmed in Microsoft Excel by
mean of the suitable level for further
performing a two-sample F-test for
variances for each of the following Table 2. Description of ginseng points across ginseng habitat suitability levels for the study area.
Suitability Level
# of Points
% of Points
scenarios. Welch's t-test, a variation of the student's t-test, was used because of the
Figure 6. Example of gaps along study area
unequal variances in this study. For the
boundary due to raster cell size.
first two tests the null hypothesis was
adjusted to be specific to each test, aiming
analysis. Ruxton (2006) suggests when
to prove or disprove the ginseng points
comparing "2 populations based on
came from the suitability level being
samples of unrelated data, then the
unequal variance t-test should always be
Table 3 shows descriptive statistics
used in preference to the Student's t-test or
of the first t-test in which ginseng points
Mann-Whitney U test." Thus using
were compared to cells from the least
Microsoft Excel, a two-sample t-test
suitable level. In this test, the t statistic
assuming unequal variances was used. If
was highly significant (p < .001) and
the null hypothesis was rejected, the
therefore the null hypothesis was rejected.
hypothesis was modified to state ginseng
The mean of the ginseng points is not
plant locations came from a combination
equal to the mean of cells from the least
of the habitat levels created by the model.
Table 3. Two-sample t-test assuming unequal
variances descriptive statistics, ginseng points (GP) against least suitable cells (LS).
Out of the 929 ginseng waypoints collected within the study area, 434 of
them, or 46.7%, were within cells labeled
as most suitable for ginseng growth. Along
with this an additional 462 waypoints were
within suitable cells. Together these points
comprised 97.4% of the ginseng points
Table 4 shows descriptive statistics
collected from 2012-2014 (suitable or
of the two-sample t-test comparing the mean of ginseng points with cells from the
suitable habitat level. Once again, the t
‘Suitable, were performed to either
statistic was highly significant (p < .001)
eliminate or show that the ginseng points
and the null hypothesis was rejected.
came from one of the less desirable habitat
Although the end result was the same as
levels created by the model. Because the
the least suitable level, there is a shift in
null hypothesis was rejected in both
the mean of the suitable cells towards the
scenarios, it can be inferred that ginseng
mean of the ginseng points. The same
points are not located in areas containing
results of the previous two tests can be
habitat specific to least suitable or suitable
seen in results of comparing the mean of
cells. If the null hypothesis was accepted,
ginseng points to the mean of cells from
then the mean of the ginseng points would
the most suitable level (Table 5).
be equal to the mean of the cells from the
least suitable or suitable level and model
Table 4. Two-sample t-test assuming unequal
variables may need to be re-examined.
variances descriptive statistics, ginseng points (GP)
Evaluating results of the second
against suitable cells (S).
and third t-tests, ginseng points vs.
suitable and ginseng points vs. most
suitable, show the mean of the suitable
level was smaller than the mean of the
ginseng points and the mean of the most
suitable level was larger than the mean of
The t statistics was highly significant (p <
the ginseng points. One could suggest that
.001), rejecting the null hypothesis. The
an equal mean between ginseng points and
mean for the most suitable cells showed a
cells from the habitat model could be
large increase compared to the means of
found by combining the two suitability
the least suitable and suitable levels and
levels. A fourth t-test was performed to
ended up being larger than the mean of the
determine if the mean of the ginseng
points was equal to the mean of cells from
the suitable and most suitable levels.
Table 5. Two-sample t-test assuming unequal
The difference between means
variances descriptive statistics, ginseng points (GP)
showed a large decrease for the fourth t-
against most suitable cells (MS).
test (Table 6). This test differed from the
previous three tests as the t statistic was
not significant (p > .05) and therefore the
null hypothesis was not rejected here.
Table 6. Two-sample t-test assuming unequal
Discussion
variances descriptive statistics, ginseng points (GP)
against suitable and most suitable cells (S/MS).
Dividing cells into three sections would
allow a solid starting point for resource
management staff, provided that the model
proves to be accurate. Many
reclassifications could take place in the
future to target areas with the next highest
The fourth t-test helps show the
suitability score.
mean of the ginseng points is equal to the
The first two t-tests, ginseng points
mean made up of cells from the suitable
vs. least suitable and ginseng points vs.
and most suitable levels. The original null
hypothesis is still rejected for the first
the 11 points were not included in this
three tests, but it can be determined that
the ginseng points do not come from cells
Accessibility is also a factor that
of the least suitable level.
could have led to potential error. Because
of the large size of the study area and the
Sources of Potential Error
short timeframe in which ginseng can be
found, it is much more advantageous for
Data were collected on many different
resource management staff to target areas
occasions, by different individuals over a
that are fairly easy to get to save time and
three-year period, during different times of
also to target areas that are easy for
day, and under different atmospheric
poachers to access as well. Because of
conditions. A combination of these factors
this, ginseng points collected may not be a
could affect the horizontal accuracy of the
normal representation of the entirety of
GPS receiver during the data collection
ginseng within the study area. Of the
process. In addition, data were collected
ginseng points collected, habitat
on different GPS receivers of different
characteristics may be much more similar
quality in which precision of location
than a random collection of ginseng points
could have varied.
that covers the whole study area.
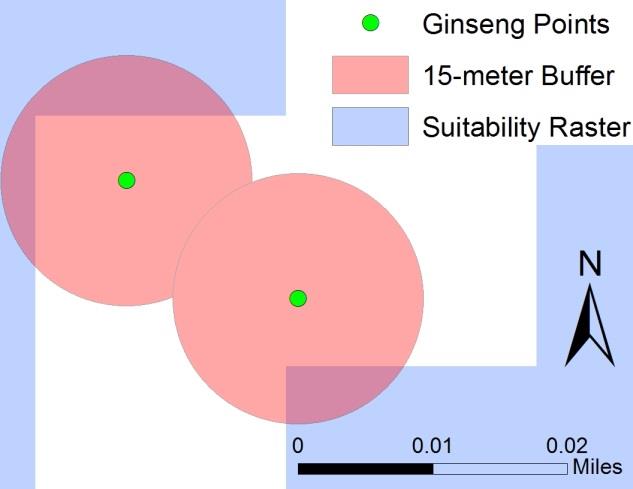
GPS horizontal accuracy error can
It should also be noted once again
reach upwards to 15 meters depending on
that each ginseng point is not
the conditions described above (Unger,
representative of a single ginseng plant.
Hung, Zhang, and Kulhavy, 2014). Some
Instead of taking a GPS waypoint for the
or all of the 11 ginseng points that
nearly 4,600 plants whose roots were
received a valued of -9999 could be within
marked, it was much more efficient to take
15 meters of a cell in the habitat suitability
one point for a cluster of plants, which was
raster (Figure 7). A useable value assigned
often the case. There was no attribute field
in the ginseng point data that described how many plants associated with each point. With this being known, the results of the parametric statistics could potentially be affected. Had a waypoint been collected for every marked plant, the number of plants and percentage of plants within a certain suitability level could have changed the results.
Error could have also occurred
during the spatial analysis portion of this study. Thirty by thirty meter cells were
used to create a general snapshot of habitat
Figure 7. Ginseng points outside of suitability
characteristics within a given area within
raster with 15-meter buffer.
the study area. Smaller cells could lead to
lengthy processing times and crashes
to any number of these points could
within the ArcMap program while larger
change the outcome of the statistical
cells may generalize too much the habitat
analysis. Because a definitive solution
characteristics over a large area. Within an
could not be found to resolve this problem,
arbitrary area, there can be many changes
in elevation, aspect, slope, canopy, or even
in say, New York, Missouri, Georgia, etc.
soil. The aim of the model in this study
and that the model should be based on
was to locate general areas where ginseng
which habitat characteristics are present at
is most likely to be found.
this specific study area. A new model
The results of the analysis will also
based off of this information could result
be affected by the manner in which the
in more favorable statistical results and
final habitat suitability raster was
possibly help crews locate areas better
reclassified and the map scale at which
suited for ginseng growth.
raster and vector data was derived.
Depending on the reclassification method
Conclusions
chosen and the number of classes chosen
could affect how many points were within
Although the results of the statistical
each suitability level. If raster and vector
analysis proved that many of the ginseng
data created under National Map Accuracy
points did not come from the most suitable
Standards was derived at a map scale of
habitat level, it does not necessarily mean
1:24,000, data has a positional accuracy of
that the model created for this project is
+/- 40 feet. This means that any cell or
not a useful tool; it just means that it could
point used in this study could potentially
be reworked to get a more favorable result.
shift any direction up to 40 feet (USGS,
A balance can be found between relying
1999). As map scale decreases positional
on statistical analysis and using reason.
accuracy decreases.
When looking back at Table 2,
97.4% of the waypoints collected were
Further Research
within the suitable or most suitable level,
with nearly half of those points in the
Another way to test the effectiveness of
latter. Given the fact that habitat layers
the habitat model would be to perform
were reclassified based on what scholars
field verification. A set number of cells
suggested through literature, a conclusion
could be randomly selected from each of
can be made that the model has potential
the three suitability levels. A small team
to be a useful tool, but further research
could mark out a 30 x 30 meter area at the
should be performed to make
coordinates of the center point for a given
cell. The number of ginseng plants could
There is potential to rework the
then be recorded as well as the type of
model based on characteristics of the
associated plants at that location. The
ginseng waypoints. Information could be
habitat variables at each cell could also be
extracted from each habitat layer and
recorded and compared to those that were
assigned to each point. Using that
used for that cell in the model.
information, a new habitat suitability layer
Further analysis could also be
could be formed to garnish a more
conducted on the ginseng data points.
favorable end result.
Instead of relying solely on literature to
But, that may not tell the whole
determine values of habitat characteristics
story. Field work must be performed be to
best for ginseng growth, best habitat
assist in creating a more accurate picture
characteristics could be extracted from the
of the usefulness of the model. Actually
known locations of ginseng points. It may
finding ginseng in the wild by using
not be the case that habitat characteristics
suggested locations created by the model
are the same in the study area as they are
is the only real way to show that a habitat
suitability model can work for such a
quinquefolius L.) in Great Smoky
Mountains National Park. 2-29.
Retrieved November 13, 2013 from
Special thanks go resource management
Ruxton, G. D. 2006. The unequal variance
staff at the study area for providing data
t-test is an underused alternative to
critical to this analysis. In addition, thanks
Student's t-test and the Mann-Whitney U
goes to the rest of the staff at the study
test. Behavioral Ecology, 17, (4).
area who contributed to the many
Retrieved January 27, 2015 from Google
strenuous hours in the field marking
ginseng roots and collecting data points.
Snow, M., and Snow, R. 2009. The
Furthermore, thanks go to John
Reestablishment of American Ginseng
Ebert, Greta Poser, and Dr. Dave
(Panax quinquefolius). WSEAS
McConville of Saint Mary's University of
Transactions on Biology and
Minnesota for their guidance throughout
Biomedicine, 6, (2), 38-47. Retrieved
the entirety of this process.
January 29, 2014 from Google Scholar.
USDA. 2014. U.S. Department of
References
Agriculture, NRCS. The PLANTS
Database. Retrieved February 13, 2014
Anderson, R. C., Anderson, R., and
from http://plants.usda.gov.
Houseman, G. 2002. Wild American
USFWS. 2015. U.S. Fish and Wildlife
Ginseng. Native Plants Journal, 3, (2),
Service. American Ginseng. Retrieved
94-105. Retrieved January 29, 2014 from
January 6, 2015 from
Hu, S. Y. 1976. The Genus Panax
american-ginseng.html.
(Ginseng) in Chinese Medicine.
USGS. 1999. U.S. Geological Survey.
Economic Botany, 30, (1), 11-28.
Map Accuracy Standards: U.S.
Retrieved February 19, 2015 from
Geological Survey Fact Sheet 171-99. 1-
2. Retrieved April 8, 2015 from
McGraw, J. B., Souther, S., and Lubbers,
A. E. 2010. Rates of Harvest and
Compliance with Regulations in Natural
Unger, D. R., Hung, I-K., Zhang, Y., and
Populations of American Ginseng
Kulhavy, D. L. 2014. Evaluating GPS
(Panax quinquefolius L.). Natural Areas
Effectiveness for Natural Resource
Journal, 30, (2), 202-210. Retrieved
Professional: Integrating Undergraduate
October 28, 2014 from Google Scholar.
Students in the Decision-Making
National Parks Conservation Association.
Process. Journal of Studies in Education,
2011. Case Study: Great Smoky
4, (4), 30-44. Retrieved April 6, 2015
Mountains National Park. Made In
from Google Scholar.
America, 40. Retrieved January 29, 2014
University of Kentucky College of
from http://www.npca.org/assets/pdf/
Agriculture. 2012. Ginseng. UK
Cooperative Extension Service, 1-6.
Rock, J. J., Tietjen, J., and Choberka, E.
Retrieved February 4, 2014 from
1999. Habitat Modeling and Protection
of American Ginseng (Panax
Van der Voort, M. E., Bailey, B., Samuel,
D. E., and McGraw, J. B. 2003.
Recovery of Populations of Goldenseal
(Hydrastis canadensis L.) and American
Ginseng (Panax quinquefolius L.)
Following Harvest. The American
Midland Naturalist, 149, (2), 282-292.
Retrieved October 28, 2014 from Google
Appendix A. American ginseng range in North America (USDA, 2014).
Appendix B. Example of Map Unit Description report for soils (USDA, 2014).
Source: http://www.gis.smumn.edu/GradProjects/WebingerS.pdf
EnvironmentalImpacts of Polyvinyl ChlorideBuilding Materials by Joe Thornton, Ph.D. A Healthy Building Network Report EnvironmentalImpacts of Polyvinyl ChlorideBuilding Materials by Joe Thornton, Ph.D. A Healthy Building Network Report This report was prepared by the author and does not represent the opinions of The University of Oregon or any of its affiliates.
April 2013 – March 2014 IAP-Network StUDyS Developing crucial Statistical methods for Understanding major complex Dynamic Systems in natural, biomedical and social sciences ordinator: Ir ene Gijbels, KUL-1 Phase VII, Contract P7/06 1 General information and list of abbreviations Main achievements per work package . . . . . . . . . . . Most important network activities . . . . . . . . . . . .

